
Expired activity
Please go to the PowerPak
homepage and select a course.
Module 1. Diabetes Defined: Pathophysiology
|
IMPORTANT DEFINITIONS
A1C: Hemoglobin A1C (A1C) is a measurement that estimates how much glucose is attached to red blood cells. A1C is assessed with a common blood test; it is used to identify patients with diabetes mellitus and, also, to evaluate diabetes control. The result of the A1C test, which is reported as a percentage, represents the average blood glucose concentration over a 2- to 3-month period. A normal result is less than 5.7%, which equates to an average blood glucose level of less than 126 mg/dL. While 5.7% is considered the upper limit of “normal,” most people with diabetes have an A1C treatment goal of less than 7.0%, although this is adjusted based on the needs of the individual.
|
INTRODUCTION
Diabetes mellitus has become a disease state of epidemic proportion, and, according to data from the International Diabetes Federation, has a worldwide prevalence of at least 8.3%.1 Currently, this equates to 387 million people – or 1 in every 12 people – who are affected by the disease worldwide. Globally, diabetes is associated with substantial financial costs, and future treatment options and potential prevention strategies will play increasingly important roles in mitigating the economic burden of diabetes.
Most simply, diabetes mellitus is characterized by higher than normal levels of glucose (or sugar) in the blood. Diabetes mellitus is classified as type 1 or type 2 diabetes.2 Type 1 diabetes is considered an auto-immune disease in which the body is unable to produce insulin due to the immune system’s destruction of the insulin-producing beta cells in the pancreas. This type of diabetes is usually diagnosed in younger individuals who appear to have a thin body type, but the onset and diagnosis of type 1 diabetes can take place at any age and in people with any body type. Type 2 diabetes is thought to be caused by a genetic predisposition and a complex medley of metabolic risk factors such as poor diet, obesity, and physical inactivity. Type 2 diabetes typically occurs in people older than 30 years of age who are also overweight. Recently, however, type 2 diabetes has been diagnosed in younger age groups. Unfortunately, with current knowledge and interventions, type 1 diabetes cannot be prevented. However, there is evidence indicating that type 2 diabetes can at least be delayed, if not prevented, with risk factor management and lifestyle interventions.3,4
PREVALENCE AND CONSEQUENCES OF DIABETES
Current estimates claim that at least 29 million people, or 9.3% of individuals in the United States (U.S.), have diabetes.5 Of these people, 27.8% are not yet diagnosed. Another 86 million adults (33% of American adults) have prediabetes. (Prediabetes is defined as blood sugar levels that are higher than normal but not high enough for a definitive diagnosis of diabetes). In 2012 alone, 1.7 million American adults aged 20 years or older were newly diagnosed with diabetes. These statistics are staggering and they are projected to continue to grow; estimates currently suggest that 1 in every 3 Americans born today will develop diabetes.
The aging population will be most impacted by the increase in the prevalence of diabetes, both in the U.S. and in other countries.6 In 2010, diabetes was reported to be the seventh leading cause of death in the U.S., but this statistic is likely underreported.5 Morbidity and mortality are not the only significant impacts of diabetes: nearly $600 billion is spent annually on diabetes in the U.S., which equates to 1 of every 9 dollars in the U.S. economy.1 The American health care system is likely unprepared to handle the complications associated with this disease and the massive financial burden it is expected to impose as the prevalence of diabetes rises. In addition, pharmacists and other health care professionals will face expanding roles in the management of the symptoms and complications of diabetes mellitus.
TYPE 1 DIABETES
Type 1 diabetes was previously known as insulin-dependent diabetes, since insulin is the only treatment option for this disease, or juvenile-onset diabetes, since its onset was typically seen in children and young adults. However, these terms have fallen out of favor because people with type 2 diabetes often use insulin and type 1 diabetes can occur at any age.
Epidemiology
Type 1 diabetes mellitus (or immune-mediated diabetes) accounts for only 5% to 10% of all diabetes cases worldwide.2 However, it is one of the most common chronic childhood disease states. Worldwide, nearly 500,000 children live with type 1 diabetes and almost 79,000 develop the disease every year.1
While the number of people with type 1 diabetes is small compared to the number of people with type 2 diabetes, the incidence of type 1 diabetes is increasing by approximately 3.2% per year.7 The reasons for the upward trend are not entirely clear, but it is important to remember that individuals diagnosed with type 1 diabetes can live well into their older adult years if the disease is managed appropriately.
Type 1 diabetes usually presents in children and young adults, but it can be diagnosed at any age and one-quarter of all type 1 diabetes diagnoses occur in adults. Type 1 diabetes accounts for the majority of new diabetes cases diagnosed in individuals younger than 20 years of age in the U.S.8 The age of presentation peaks at the 2 distinct life stages: a peak occurs from 4 to 6 years of age and the other peak occurs in early puberty (i.e., 10 to 14 years of age).9 Overall, approximately 45% of children with type 1 diabetes are diagnosed when they are younger than 10 years old.2
Clinical presentation
Type 1 diabetes can present in several different ways and the symptoms of type 1 diabetes can become serious very quickly because the body produces very little or no insulin. Children tend to present with an abrupt onset of increased thirst (polydipsia), increased urination (polyuria), weight loss, and hyperglycemia (excessive glucose in the blood).10 Hyperglycemia must exceed any of the following thresholds to be classified as diabetes: random plasma glucose of greater than or equal to 200 mg/dL, fasting plasma glucose of greater than or equal to 126 mg/dL, or A1C of greater than or equal to 6.5%.11 Children with these symptoms usually appear slightly ill with nonspecific complaints, such as lack of energy and weight loss, although weight loss occurs in only half of children diagnosed.12 Polyuria may present as bed-wetting or daytime increased urinary frequency and/or incontinence in a previously potty-trained child. Other symptoms may include blurred vision, drowsiness, poor stamina, frequent skin and bladder infections, and vaginitis. Adults present similarly, but symptoms may not be as abrupt or severe. For adults, longer time frames from the onset of disease to the diagnosis often occur as the result of a decreased rate of beta cell destruction.2 At the time of diagnosis, 80% to 90% of beta cells have already been destroyed in many patients.
Type 1 diabetes can first present as diabetic ketoacidosis (DKA), which is one of the most concerning complications associated with this disease. In diabetes, sugars cannot be processed and properly used for energy, and, as a result, ketones build up in the blood. High levels of ketones in the blood can lead to coma and even death because ketones promote brain swelling and other metabolic disturbances. This syndrome is characterized by nausea and vomiting, breathlessness, and abdominal pain.13 In addition, patients may also develop a fruity-smelling breath, increased drowsiness and lethargy, and associated confusion. DKA also leads to profound dehydration associated with polyuria and, sometimes, acute vomiting.14 Laboratory values will indicate the presence of hyperglycemia, glucosuria (glucose in the urine), ketonemia (ketones in the blood), and ketonuria (ketones in the urine). Approximately 20% to 40% of patients with type 1 diabetes present with DKA at the time of diagnosis and require hospitalization.2
Children are more likely than adults to present in DKA,13 and DKA in children reportedly occurs at the time of diagnosis in approximately 25% to 30% new cases.14 Children younger than 6 and children from adverse socioeconomic backgrounds are more likely to present in DKA than older patients or people with higher socioeconomic statuses.15 Patients with DKA require immediate treatment, including rehydration and insulin therapy in the hospital setting.2
After a diagnosis of type 1 diabetes, many patients enter a honeymoon phase, in which there is some insulin still being produced in the body and only small amounts of exogenous insulin are required to maintain glycemic control.16 This period is usually short lived and full therapeutic doses of insulin are soon required.
Pathophysiology
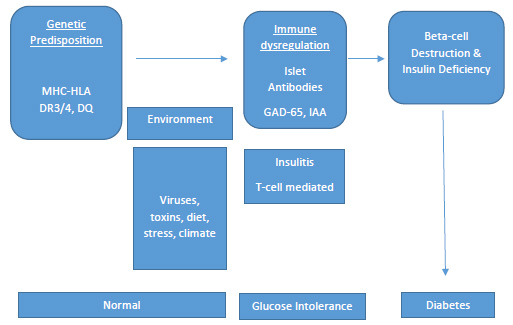
Type 1 diabetes has long been believed to result from an interplay between genetics and environmental factors (Figure 1). More specifically, in a person who is genetically predisposed to the disease, environmental triggers are thought to cause an autoimmune response that leads to the destruction of insulin-producing beta cells in the pancreas. Ultimately, this leads to insulin deficiency and metabolic abnormalities.8,17 The exact mechanism of how beta cell autoimmunity is initiated after exposure to a precipitating environmental factor is not yet understood.
Circulating antibodies to insulin-producing cells in the body are often present long before the symptoms of the disease appear.23 Antibodies produced against cells in the pancreas have been identified in 85% of patients with newly diagnosed type 1 diabetes, as well as in individuals with prediabetes. Antibody testing can be completed in individuals who have a family history of type 1 diabetes to assess if they may be at increased risk for developing the disease. Lack of these “autoantibodies” does not necessarily indicate that a person will never develop type 1 diabetes, but the presence of antibodies increases the risk of developing the disease.
Figure 1. Progression of Type 1 Diabetes18,19
Risk factors
There are many risk factors that influence the development and appearance of type 1 diabetes. Some of these factors are modifiable and manageable, but some are non-modifiable and confer an increased risk of the disease despite lifestyle changes.
Family history. The lifetime risk of developing type 1 diabetes is substantially greater for people who have close relatives with type 1 diabetes. The risk of type 1 diabetes in the general population is reported to be approximately 1 in 400, or 0.25%.20 A person is at increased risk if either his or her mother or father has type 1 diabetes. If both parents have type 1 diabetes, the risk is substantially greater, reportedly as high as 30%. Additionally, the sibling risk is similar to the risk with a single parent contributor: 3% to 6% for non-twins. The incidence increases to as much as 50% for identical twins.
Race and ethnicity. Ethnic differences in the rates of type 1 diabetes are apparent in the U.S. According to a 2009 study that sampled large multiethnic populations, the highest prevalence of type 1 diabetes occurs in non-Hispanic white youths.22 The disease occurs in non-Hispanic whites younger than 20 years of age at a rate of 23.6 cases per 100,000 person-years.9 After non-Hispanic youths, the incidence was highest for African-Americans, followed by Hispanics, Asian-Pacific Islanders, and American Indians.
Autoimmunity. Type 1 diabetes is an autoimmune disease, so people with type 1 diabetes are more likely to be diagnosed with other autoimmune disorders, including celiac disease, thyroid disorders (e.g., Graves’ disease and Hashimoto’s thyroiditis), Addison’s disease, and multiple sclerosis.2 This suggests that simply having one autoimmune disorder, including type 1 diabetes, may put a person at greater risk for another.
Environmental associations. Despite multiple research efforts aimed at identifying specific environmen-tal triggers for type 1 diabetes, no clear factor has been linked to disease onset.16 However, geographic location may play a role in predicting the development of type 1 diabetes. The incidence of type 1 diabetes is quite variable across the world, but the risk appears to rise according to a person’s distance from the equator.24 The highest reported incidences of type 1 diabetes occur in Finland and Sardinia, with rates almost 400 times higher than those in children in China and Venezuela, which have the lowest incidences.25,26 Still, wide variations in incidence among locations of similar latitude suggest that other fac-tors, besides location, are major contributors to the development of the disease.
The risk to a fetus for developing type 1 diabetes may include factors such as maternal age older than 25 years, maternal diet, maternal infections, and jaundice.27 Autoantibodies associated with type 1 diabetes often develop early in infancy, which suggests that fetal exposures may play a role in future disease development. More research is needed in this area for a definitive causative factor to be identified.
Both specific childhood virus exposures and low overall rates of infections in childhood have been proposed as possible environmental causes of type 1 diabetes.28 However, evidence concerning this relationship is not conclusive and no specific viruses have been conformed to be involved in the development of the disease. To further confound the issue, there is evidence that other viruses may protect against the development of type 1 diabetes. One study even showed increased rates of diabetes in mice that were raised in pathogen-free environments.29
It has also been suggested that proteins in cow’s milk may trigger an autoimmune response that can lead to type 1 diabetes.30 This may result from either early exposure to some component of albumin in the milk or from an immune response to beta-casein, a protein found in cow’s milk. Longer duration of breast-feeding and supplementation with Vitamin D have been reported to provide partial protection against autoimmunity and type 1 diabetes. Research in this area is ongoing and other studies have not found any associations between increased rates of type 1 diabetes and early exposure to cow’s milk or shorter duration of breast-feeding.31
TYPE 2 DIABETES
Type 2 diabetes was previously referred to as non-insulin-dependent diabetes, since treatments other than exogenous insulin are available for this disease, or adult-onset diabetes, since this disease state is generally diagnosed in adults older than 30 years of age. Similar to older terms for type 1 diabetes, these terms are no longer preferred because the onset and treatments vary widely for type 2 diabetes.
Epidemiology
Type 2 diabetes makes up the majority of diabetes diagnoses and accounts for approximately 90% to 95% of all diabetes cases worldwide.1 The type 2 diabetes epidemic in the U.S. is most certainly linked to increasing rates of overweight and obese persons. The prevalence of type 2 diabetes is 3 to 7 times higher for obese adults than for adults who have optimal body weights.19 Type 2 diabetes is common in both older and non-white populations in the U.S. As many as 27% of Americans older than 60 years of age have the disease.5 While type 2 diabetes was historically a disease of adulthood, the disease can be diagnosed at any age and data suggest that diagnoses of type 2 diabetes are increasing in younger populations. Of children diagnosed with type 2 diabetes, 94% are of minority descent. Children who are overweight or obese have an increased risk of the disease compared to normal-weight children.
Clinical presentation
Like type 1 diabetes, type 2 diabetes is characterized by high blood sugar levels. However, unlike type 1 diabetes, the onset of type 2 diabetes tends to progress slowly. Type 2 diabetes is largely a result of gradually worsening insulin resistance, which is a phenomenon that results when the tissues of the body, such as muscle and fat, are less responsive than normal to the actions of insulin. This results in less glucose making its way out of the bloodstream and into the tissues. Typical initial symptoms of type 2 diabetes in adults include fatigue, dry skin, poor wound healing, dry mouth, and blurred vision; sometimes, there are no symptoms at all.32 Symptoms tend to be poorly differentiated, but they can also present overtly, similar to those of type 1 diabetes, especially if the disease has gone undetected for a long period of time. The severity of symptoms at presentation reflects the level of insulin resistance and the degree of beta cell damage that has occurred. Many people already experience diabetes-related complications at initial presentation and this has led scientists to estimate that diabetes may be present for many years prior to diagnosis. Examples of diabetes-related complications include neuropathy (nerve damage), retinopathy (eye damage to the retina), nephropathy (damage to the kidneys), and cardiovascular disease. Because symptoms at presentation vary widely and are often not recognized early in the disease process, screening of high-risk persons is critical for identifying those with prediabetes or undiagnosed diabetes and preventing worsening of the disease.
As many as 85% of children diagnosed with type 2 diabetes are overweight or obese and nearly all of these children have a first-degree relative with the disease.33 In general, children present with glucose in the urine but no evidence of ketonuria, mild thirst complaints, possible slight increase in urination, and little or no weight loss.32 Polycystic ovary syndrome and acanthosis nigricans (thickening and darkening of skin in the neck, groin, or armpit region) are disorders associated with insulin resistance that are commonly seen in children presenting with type 2 diabetes.
Pathophysiology
Type 2 diabetes is a progressive disease caused by multiple complex metabolic factors that result from defects in several organs. While the mechanisms of this process are not completely understood, the following abnormalities are clearly present: insulin resistance in muscle and adipose tissue, a progressive decline in pancreatic insulin secretion, elevated glucagon levels (which causes increased glucose production in the liver), and diminished production of specific gastrointestinal hormones called incretins.2
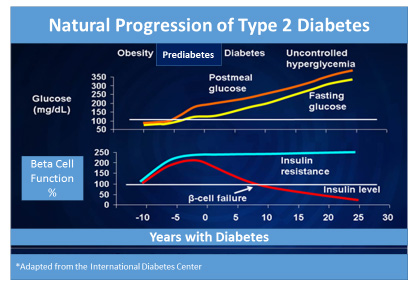
Type 2 diabetes develops gradually over time, sometimes taking several years to progress, and several stages define the progression of type 2 diabetes (Figure 2). Phase 1 is considered the initial stage of the disease during which insulin resistance first occurs, along with impaired insulin sensitivity, and is soon followed by compensatory insulin hypersecretion.32 Almost all patients are asymptomatic at this stage and clinicians are unaware of the disease process. Phase 2, also called prediabetes, occurs when pancreatic beta cell secretion of insulin is further impaired: an abnormal rise of blood sugar occurs after meal intake and fasting glucose levels rise. Fasting blood glucose typically rises to 100 mg/dL or higher (100 to 125 mg/dL), which is referred to as impaired fasting glucose. Also, 2-hour post-meal glucose levels climb to 140 mg/dL or higher (140 to 199 mg/dL), which is referred to as impaired glucose tolerance, and A1C readings are slightly elevated to 5.7% or greater (5.7% to 6.4%) during phase 2.11,19 Lastly, overt diabetes occurs in phase 3 as the result of the progressive decline in beta cell function and additional decreases in insulin production. Lack of insulin sensitivity is accompanied by increased hepatic glucose production.32
Fasting glucose levels in phase 3 are diagnostic of diabetes (126 mg/dL or greater). However, most people will still not experience any definitive or recognizable symptoms of diabetes.
It is important to remember that, among people with risk factors for the disease, progression to diabetes is not inevitable. Several studies, including the Diabetes Prevention Program Research Group, have shown that people with prediabetes who exercise regularly and lose weight can at least delay, if not prevent, the onset of type 2 diabetes.4
Figure 2. Natural Progression of Type 2 Diabetes34
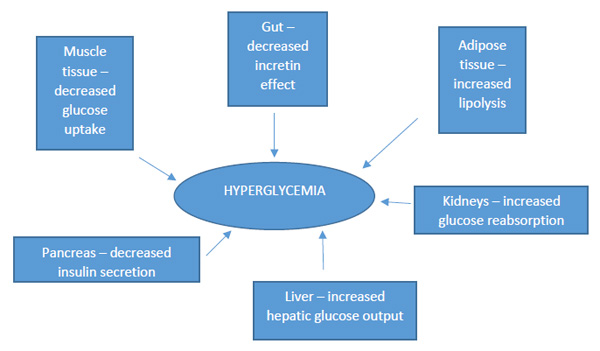
Insulin resistance. Type 2 diabetes is a complex syndrome characterized by 2 defective insulin-mediated processes: impaired glucose metabolism into insulin-sensitive tissues due to insulin resistance and decreased effectiveness of insulin to suppress glucose production by the liver (Figure 3).35 Central obesity appears to be one of the most important causes of insulin resistance. In turn, insulin resistance contributes to cholesterol abnormalities, as evidenced by increases in “bad” cholesterol (i.e., low-density lipoprotein) and decreases in “good” cholesterol (i.e., high-density lipoprotein) in people with insulin resistance. The presence of multiple risk factors for heart disease, including central obesity, elevated cholesterol, increased blood glucose, and/or hypertension is called metabolic syndrome.2,36 Patients with metabolic syndrome are at especially high risk for diabetes and diabetes-related complications.
Beta cell dysfunction. Normally, pancreatic beta cells (the cells in the pancreas that make and release insulin) respond to changes in blood glucose and food intake to maintain normal blood glucose levels throughout the day.19 Beta cell function is impaired in people with type 2 diabetes: when blood sugar rises in people with insulin resistance, the pancreas is initially able to compensate by producing more insulin; however, eventually the pancreas becomes “overworked” and is no longer able to produce sufficient insulin for the body’s demands. Approximately 70% of beta cell function is already lost by the time a person reaches the criteria for a diagnosis of type 2 diabetes.37
Glucose production in the liver. A secondary cause of increasing blood glucose levels is excessive glucose production by the liver (often referred to as “hepatic glucose production”).2 In fasting conditions, glucose is produced by the liver; however, the liver of a person with diabetes will produce substantially more glucose and burden the circulation with extra glucose due to excess levels of a hormone called glucagon. Under normal conditions, glucagon signals the liver to move glucose into the bloodstream when needed by the body. In patients with type 2 diabetes, glucagon levels are inappropriately elevated. Insulin normally facilitates glucose uptake into the muscle and fat tissues and signals the liver to decrease hepatic glucose production. When insulin levels are too low to facilitate glucose uptake and signal the liver (as in diabetes), the liver continues to produce glucose, which causes blood glucose levels to rise.
Incretin effect. Incretin hormones (referred to simply as “incretins”) that are released from the gastroin-testinal tract also play a role in the pathophysiology of type 2 diabetes. Incretins are naturally occurring hormones that the gut releases throughout the day to assist the pancreas and liver in responding to variations in blood glucose.31 The main incretins responsible for this are thought to be glucose-dependent insulinotropic peptide (GIP) and glucagon-like peptide-1 (GLP-1). The activity levels of these incretins increase substantially when food is ingested. When blood glucose levels rise, both GIP and GLP-1 stimulate beta cells to secrete insulin and suppress glucagon release. Patients with prediabetes and type 2 diabetes are relatively deficient in GLP-1. This deficiency contributes to excess hepatic glucose production, failure to suppress production of glucagon after meals, and increased appetite. People with type 2 diabetes also have increased dipeptidyl peptidase-4 (DPP-4) activity in the fasting state. (DPP-4 is the enzyme that breaks down incretin hormones in the body.) This finding may explain why GLP-1 secretion is impaired after meals in people with type 2 diabetes.18
Figure 3. Select Contributing Factors in the Pathophysiology of Type 2 Diabetes2,19,35
Risk factors
Like for type 1 diabetes,there are many risk factors that influence the development of type 2 diabetes. Family history, genetics, lifestyle factors, and environmental exposures have all been associated with increased risks of the disease.
Family history and ethnicity. The development of type 2 diabetes is clearly linked to family history: at least 39% of patients with type 2 diabetes have at least one family member with the disease.39 Additionally, the prevalence of type 2 diabetes varies tremendously among groups with different ethnic origins: non-white Americans of African, Native American, and Hispanic origin have 2 to 6 times higher rates of type 2 diabetes than whites living in the same environments.40 First-degree relatives of patients with type 2 diabetes are at least 3 times more likely to develop the disease than those without a family history of the disease.32 This clustering of type 2 diabetes within family lines is complicated by other factors, including shared environmental risk factors such as obesity and sedentary lifestyle, meaning that family history is likely only partially responsible for the development of the disease. Furthermore, type 2 diabetes is much more common than type 1 diabetes and the appearance of subsequent family members with the disease may simply reflect the disease’s high prevalence.
Genetics. The genetic influences of type 2 diabetes are quite complex and not completely understood. Most cases of type 2 diabetes involve many genes that contribute small parts to the overall condition. More than 36 genes that contribute to risks for type 2 diabetes have been identified, but only 10% of the heritability of type 2 diabetes can be explained.19 For most patients, it is impossible to identify genetic abnormalities that predominate the risks for type 2 diabetes.
Environmental factors. Obesity, aging, a longer life span, smoking, insufficient energy consumption, and physical inactivity are environmental influences that affect the onset and progression of type 2 diabetes.41 Central or visceral obesity is especially problematic and is a major contributor to insulin resistance. Decreased daily activity related to modern technology and changes in the American diet, including increased fat intake, increased simple sugar intake, and decreased dietary fiber intake, all contribute to the obesity epidemic. Even mild obesity can contribute to glucose intolerance. People of Japanese origin are especially prone to central obesity and, thus, a lower body mass index target (18.5 to 23 kg/m2) has recently been suggested for this population.11 Smoking also increases the risk for diabetes, as well as the risk for long-term complications, by 30% to 40%.42
Many medications can impair glucose tolerance by decreasing beta cell insulin secretion, increasing glucose production in the liver, or causing insulin resistance. Glucocorticoids, oral contraceptives, beta-blockers, thiazide diuretics, statins, protease inhibitors, atypical antipsychotics, cyclosporine, and tacrolimus are well-known drugs that contribute to impaired glucose tolerance.43 Pharmacists should be especially vigilant to review all medications for patients with diabetes – and those at risk for diabetes – for possible hyperglycemia-related adverse events.
SUMMARY
Diabetes is an increasing concern within the U.S. and around the world. Its remarkable growth rate has reached an epidemic proportion in recent years. While most cases of diabetes diagnosed in the U.S. are type 2 diabetes, the number of cases of type 1 diabetes is increasing.1,5 It is difficult to pinpoint the exact cause of diabetes, but it is clear that environmental exposures, lifestyle factors, and genetics all play integral and interrelated roles in the development of the disease. Regardless of the etiology, all types of diabetes are associated with long-term complications. Disappointing data show that A1C values tend to increase by 1% every 2 years, even with the most aggressive treatments.44 Patients with diabetes require repeated interventions and continuous compliance to therapies for success. Pharmacists can be advocates for evidence-based practices to decrease the clinical inertia related to diabetes treatment. Additionally, future attempts to prevent and/or reverse diabetes are more likely to succeed if they reflect the most recent advances in the understanding of the complex pathogenesis of the disease. Pharmacists play an important role in communicating medical information to patients about diabetes and must stay updated on new prevention techniques, treatment devices, and therapies.
|
When should a patient be referred to the pharmacist?
Health screenings are a major opportunity for the pharmacy staff to identify patients that may be at risk for diabetes. This module has supplied pharmacy technicians with the framework for what constitutes prediabetes and what risk factors are associated with the development of type 1 and type 2 diabetes. Technicians should remember several key points and refer patients to a pharmacist when appropriate.
- Prediabetes is indicated by fasting blood sugar levels ranging from 100 to 126 mg/dl and after-meal blood sugar levels of 140 to 199 mg/dl. A blood glucose level in these ranges or higher should be concerning and prompt a patient to be referred to the pharmacist for a consultation.
- Some early symptoms of diabetes are increased thirst, increased urination, increased hunger, and weight loss. If a patient presents with any of these, refer him or her to the pharmacist for a consultation.
- Patients with diabetes or at risk for diabetes should adhere to healthy diets and lifestyle choices. Some pharmacies have dietitians available for consultations, but, if one is not available, refer patients to the pharmacist for suggestions on healthy diet plans or where to find such information. Smoking puts patients with diabetes at especially high risk for complications. If a patient is a current smoker, refer him or her to a pharmacist for smoking cessation evaluation and consultation.
|
References
- International Diabetes Federation. IDF Diabetes Atlas, 2014 update. 6th ed. Brussels, Belgium: International Diabetes Federation; 2013. https://www.idf.org/sites/default/files/EN_6E_Atlas_Full_0.pdf. Accessed January 11, 2016.
- Triplitt CL, Reasner CA. "Diabetes Mellitus." In: Dipiro JT, Talbert RL, Yee GC, et al, eds. Pharmacotherapy: A Pathophysiologic Approach. 8th ed. New York, NY: McGraw-Hill Medical; 2011.
- The Diabetes Control and Complications Trial (DCCT) Research Group. The effect of intensive treatment of diabetes on the development and progression of long term complications in insulin-dependent diabetes mellitus. N Engl J Med. 1993;329(14):977-986.
- Knowler WC, Barrett-Connor E, Fowler SE, et al; for the Diabetes Prevention Program Research Group. Reduction in the incidence of type 2 diabetes with lifestyle intervention or metformin. N Engl J Med. 2002;346(6):393-403.
- Centers for Disease Control and Prevention. National Diabetes Statistics Report: Estimates of Diabetes and Its Burden in the United States. 2014; Atlanta, GA. National Center for Chronic Disease Prevention and Health Promotion: Division of Diabetes Translation. Centers for Disease Control and Prevention web site. http://www.cdc.gov/diabetes/pubs/statsreport14/national-diabetes-report-web.pdf. Accessed November 9, 2016.
- Whiting DR, Guariguata L, Weil C, Shaw J. IDF diabetes atlas: global estimates of the prevalence of diabetes for 2011 and 2030. Diabetes Res Clin Pract. 2011;94(3):311-321.
- Patterson CC, Dahlquist GG, Gyürüs E, et al; for the EURODIAB Study Group. Incidence trends for childhood type 1 diabetes in Europe during 1989-2003 and predicted new cases 2005-20: a multicentre prospective registration study. Lancet. 2009;373(9680):2027-2033.
- Duncan GE. Prevalence of diabetes and impaired fasting glucose levels among US adolescents: National Health and Nutrition Examination Survey, 1999-2002. Arch Pediatr Adolesc Med. 2006;160(5):523-528.
- Dabelea D, Bell RA, D'Agostino RB Jr, et al; for the Writing Group for the SEARCH for Diabetes in Youth Study Group. Incidence of diabetes in youth in the United States. JAMA. 2007;297:2716-2724.
- Banion C, Valentine V. "Type 1 diabetes throughout the life span." In: Mensing CE, Cornell S, Halstenson C, eds. The Art and Science of Diabetes Self-Management Education Desk Reference. 3rd ed. Chicago, IL: American Association of Diabetes Educators; 2014.
- American Diabetes Association. Standards of medical care in diabetes-2016; Abridged for primary care providers. Clin Diabetes. 2016;34(1):3-21.
- Silverstein J, Klingensmith GK, Copeland K, et al. Care of children and adolescents with type 1 diabetes. Diabetes Care. 2005;28(1):186-212.
- Beisswenger PJ. "Type 1 diabetes." In: Leahy JL, Clark NG, Cefalu WT, eds. Medical Management of Diabetes Mellitus. New York, NY: Marcel Dekker; 2000.
- Agus MS, Wolfsdorf JI. Diabetic ketoacidosis in children. Pediatr Clin North Am. 2005;52(4):1147-1163.
- Rewers A, Chase HP, Mackenzie T, et al. Predictors of acute complications in children with type 1 diabetes. JAMA. 2002;287(19):2511-2516.
- Simmons K, Michels AW. Lessons from type 1 diabetes for understanding natural history and prevention of autoimmune disease. Rheum Dis Clin North Am. 2014;40(4):797-811.
- Thrower SL, Bingley PJ. Prevention of type 1 diabetes. Br Med Bull. 2011;99:73-88.
- Ozougwa JC, Obimba KC, Belonwu CD, Unakalamba CB. The pathogenesis and pathophysiology of type 1 and type 2 diabetes mellitus. J Physiology and Pathophysiology. 2013;4(4):46-57.
- Bardsley JK, Magee MF. "Pathophysiology of the metabolic disorder." In: Mensing C, Cornell S, Halstenson C, eds. The Art and Science of Diabetes Self-Management Education Desk Reference. 3rd ed. Chicago, IL: American Association of Diabetes Educators; 2014.
- Haller MJ, Atkinson MA, Schatz D. Type 1 diabetes mellitus: etiology, presentation, and management. Pediatr Clin North Am. 2005;52(6):1553-1578.
- Tillil H, Köbberling J. Age-corrected empirical genetic risk estimates for first-degree relatives of IDDM patients. Diabetes. 1987;36(1):93-99.
- Dabelea D, Mayer-Davis EJ, Saydah S, et al; for the SEARCH for Diabetes in Youth Study. Prevalence of type 1 and type 2 diabetes among children and adolescents from 2001 to 2009. JAMA. 2014;311(17):1778-1786.
- Atkinson MA, Maclaren NK. Mechanisms of disease: the pathogenesis of insulin-dependent diabetes mellitus. N Engl J Med. 1994;331(21):1428-1436.
- Rosenbauer J, Herzig P, von Kries R, et al. Temporal, seasonal, and geographic incidence patterns of type 1 diabetes mellitus in children under 5 years of age in Germany. Diabetologia. 1999;42(9):1055-1059.
- Yang Z, Wang K, Li T, et al. Childhood diabetes in China. Enormous variation by place and ethnic group. Diabetes Care. 1998;21(4):525-529.
- Harjutsalo V, Sund R, Knip M, Groop PH. Incidence of type 1 diabetes in Finland. JAMA. 2013;310(4):427-428.
- Stene LC, Magnus P, Lie RT, et al; for the Norwegian Childhood Diabetes Study Group. Birth weight and childhood onset type 1 diabetes: population based cohort study. BMJ. 2001;322(7291):889-892.
- Bortell R, Pino SC, Greiner DL, et al. Closing the circle between the bedside and the bench: Toll-like receptors in models of virally induced diabetes. Ann N Y Acad Sci. 2008;1150:112-122.
- Bach JF. The effect of infections on susceptibility to autoimmune and allergic diseases. N Engl J Med. 2002;347(12):911-920.
- Knip M, Akerblom HK. Early nutrition and later diabetes risk. Adv Exp Med Biol. 2005;569:142-150.
- Sipetic S, Vlajinac H, Kocev N, et al. Early infant diet and risk of type 1 diabetes mellitus in Belgrade children. Nutrition. 2005;21(4):474-479.
- Vivian EM. "Type 2 diabetes throughout the life span." In: Mensing C, Cornell S, Halstenson C, eds.. The Art and Science of Diabetes Self-Management Education Desk Reference. 3rd ed. Chicago, IL: American Association of Diabetes Educators; 2014.
- American Diabetes Association. Type 2 diabetes in children and adolescents (consensus statement). Diabetes Care. 2000;23(3)381-389.
- Bergenstal R. "Natural History of Type 2 Diabetes" diagram. In: Translating Diabetes Medications into Protocol. The Many Faces of Community Health conference. International Diabetes Center web site. http://www.manyfacesconference.org/conference2008/Bergenstal%20Many%20Faces.pdf. Accessed January 12, 2016.
- Leahy JL. "Type 2 diabetes mellitus." In: Leahy JL, Clark NG, Cefalu WT, eds. Medical Management of Diabetes Mellitus. New York, NY: Marcel Dekker; 2000.
- Cefalu WT. "Insulin resistance." In: Leahy JL, Clark NG, Cefalu WT, eds. Medical Management of Diabetes Mellitus. New York, NY: Marcel Dekker; 2000.
- Nichols GA, Hillier TA, Brown JB. Progression from newly acquired impaired fasting glucose to type 2 diabetes. Diabetes Care. 2007;30(2):228-233.
- Deacon CF. What do we know about the secretion and degradation of incretin hormones? Regul Pept. 2005;128(2):117-124.
- Klein BE, Klein R, Moss SE, Cruickshanks KJ. Parental history of diabetes in a population-based study. Diabetes Care. 1996;19(8):827-830.
- Carter JS, Pugh JA, Monterrosa A. Non-insulin-dependent diabetes mellitus in minorities in the United States. Ann Intern Med. 1196;125(3):221-232.
- Sullivan PW, Morrato EH, Ghushchyan V, et al. Obesity, inactivity, and the prevalence of diabetes and diabetes-related cardiovascular comorbidities in the U.S., 2000-2002. Diabetes Care. 2005;28(7):1599-1603.
- U.S. Department of Health and Human Services. 2014 Surgeon General's Report: The Health Consequences of Smoking—50 Years of Progress: A Report of the Surgeon General. Atlanta, GA: U.S. Department of Health and Human Services, Centers for Disease Control and Prevention, National Center for Chronic Disease Prevention and Health Promotion, Office on Smoking and Health, 2014. Centers for Disease Control and Prevention web site. http://www.cdc.gov/tobacco/data_statistics/sgr/50th-anniversary/index.htm. Accessed October 20, 2016.
- Luna B, Feinglos MN. Drug-induced hyperglycemia. JAMA. 2001;286(16):1945-1948.
- Fonseca VA. Defining and characterizing the progression of type 2 diabetes. Diabetes Care. 2009;32(suppl 2):S151-S156.
Back to Top