
Expired activity
Please go to the PowerPak
homepage and select a course.
Incorporating Cancer Immunotherapies Into the Oncology Treatment Arsenal in Managed Care Settings: Navigating the Complexities of Value Assessment & Cost Optimization in the Era of Immuno-Oncology
Welcome and Introduction
Dr. Kenney: Welcome to our program: “Incorporating Cancer Immunotherapies into the Oncology Treatment Arsenal in Managed Care Settings: Navigating the Complexities of Value Assessment and Cost Optimization in the Era of Immuno-Oncology.” The panelists today are Dr. Michael Atkins and myself, Jim Kenney.
During today's discussions, we would like you to consider the four Ps: What are the potential implications for the patient, the provider, the pharmacy, and the plan? Certainly, the issue of immuno-oncology (IO) is a complex one that involves all aspects of the delivery system. So, even though many of these agents are delivered on the medical side of the benefit, there can be pharmacy benefit issues as well.
We need to think about integrating the benefit, we need to think about coordinating care, making sure that the patients have the appropriate resources that they need, whether it is nursing support, pharmacist support—obviously the treating physicians—and trying to integrate all of that information and data, so we get the best response to treatment and the best outcomes for the patients.
Essentials of Cancer Immunotherapy: What Do Managed Care Professionals Need to Know?
Slide 1
Dr. Atkins: I am going to talk about some of the principles behind immunotherapy and then, with that as a background, talk about it from the treating physician's perspective and the value of immunotherapy relative to other treatments that we have used for cancer.
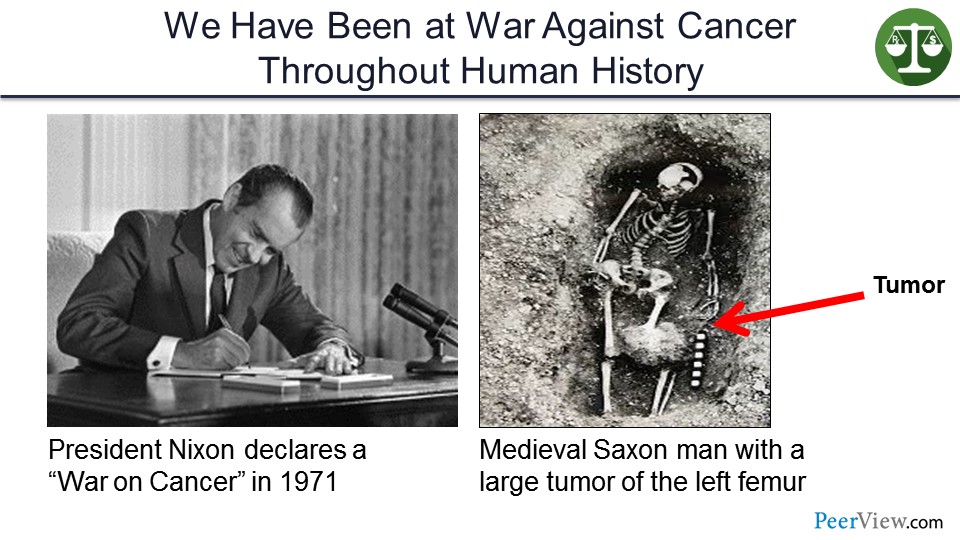
In 1971, President Nixon declared war on cancer and established the National Cancer Institute. But, in truth, we have been at war against cancer throughout human history. And this is an example of a tumor in the thigh of a medieval Saxon man that was uncovered when his grave was uncovered, probably an osteosarcoma.
Slide 2
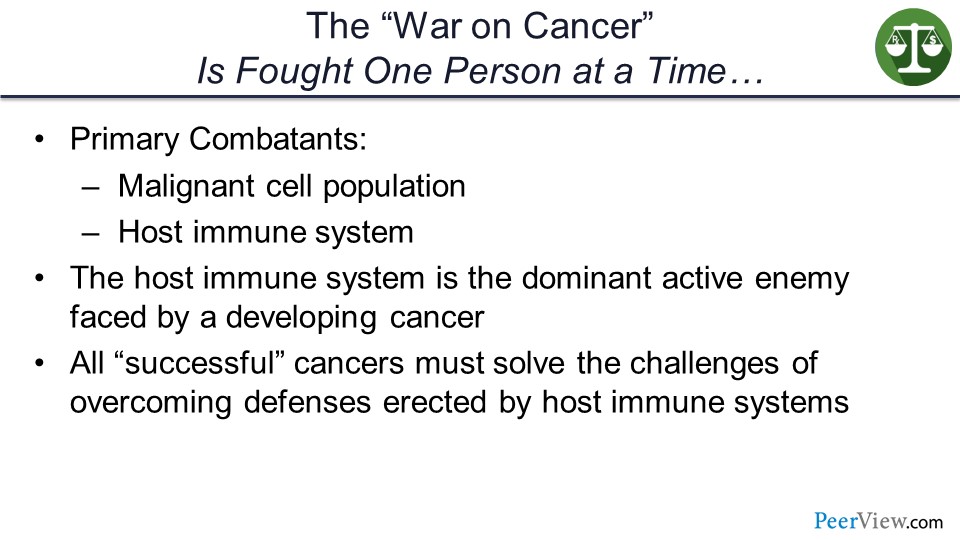
But the war on cancer is not fought between the National Cancer Institute and cancer at large, or even between the medical oncologist and cancer, or even, though it might seem so, the managed care pharmacist and the oncologist who work in your team. The war on cancer is fought one person at a time, and the primary combatants are the malignant cell population and the host immune system.
The host immune system is the dominant active enemy faced by any developing cancer. And all successful cancers must, therefore, solve the challenges of overcoming defenses erected by the host immune system in order to survive.
Slide 3
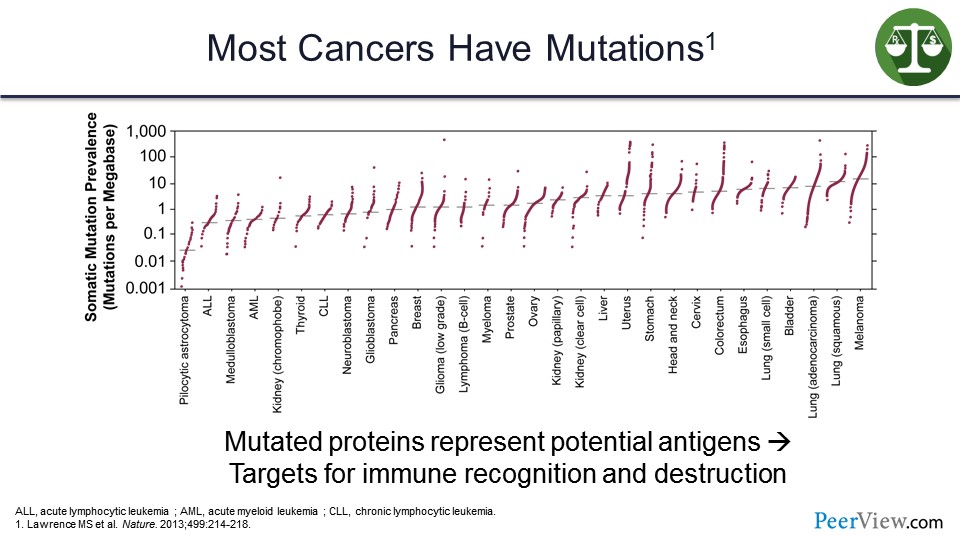
So, why does the immune system recognize cancers? Well, cancers are full of mutations, and there are a lot of mutations that we have heard about in the previous decade that have been discovered that drive cancers and that could be targeted with targeted therapies. But there are many, many more passenger mutations that lead to abnormal proteins presented on the surface of the cancer cell, which are foreign and can be recognized by the immune system and distinguished as nonself.
These mutated proteins represent potential targets for immune recognition and destruction. And, as you will see from this list on the slide, the more mutations a tumor has, the more likely it is to be on the list of tumors that respond to immune therapy.
Slide 4
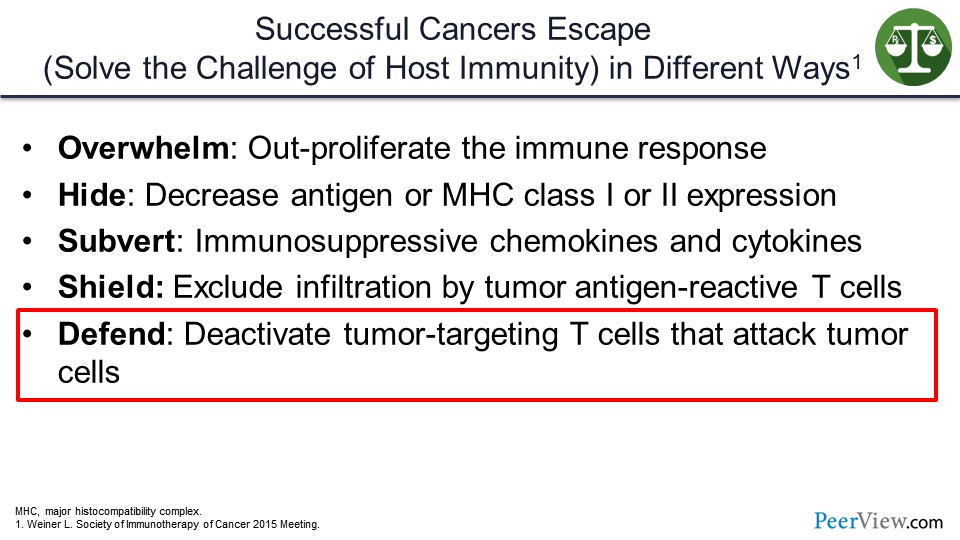
How do cancers solve the challenge of escaping the host immune system? They do so in several ways. Some can overwhelm or out-proliferate the immune system. Others can hide by decreasing the amount of antigen that is presented to the immune system by decreasing major histocompatibility complex class I and II.
Others can subvert the immune system by making immunosuppressive chemokines or cytokines or shield themselves from the immune system by making fibrous protective capsules that the T cells cannot actually get through, such as pancreatic cancer. But many tumors, as it turns out, defend themselves against immune attack by deactivating tumor-targeted T cells within the tumor microenvironment.
Slide 5
So, when we are using immune therapy, we are actually treating the immune system so that it can actually treat the cancer. We are identifying what those defenses are and trying to take them down, so the immune system will now work. And because the activated immune system can target many tumor antigens simultaneously and deepen and broaden over time, immunotherapy can actually cure patients with metastatic cancer.
And the hallmark of an effective immunotherapy is the tail on the survival curve or plateau.
Slide 6
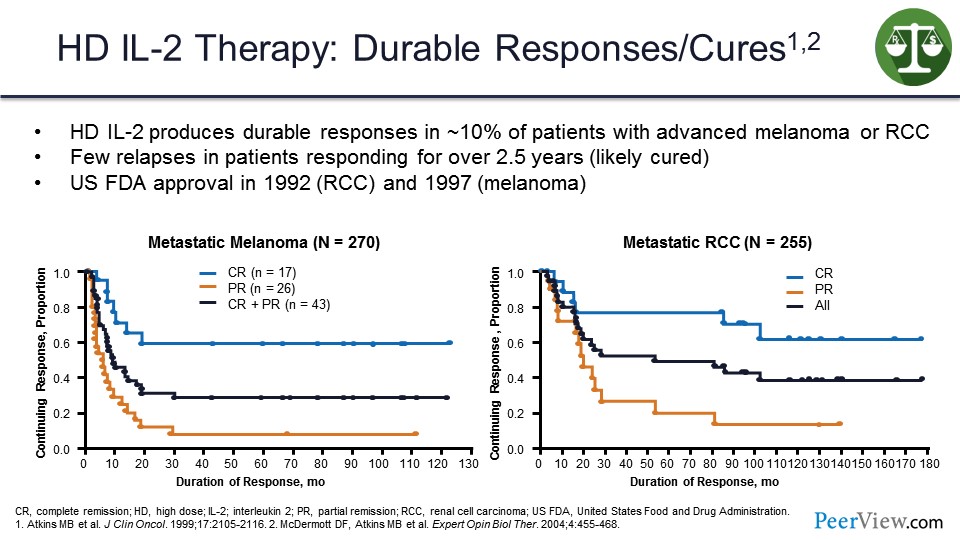
And we knew this from the early days when we were doing high-dose interleukin 2 (IL-2), and these are two response duration curves for patients with melanoma or kidney cancer treated with high-dose IL-2 where we saw that there were responses that were complete and durable in about 10% of patients.
Any patient who was still responding at 2 years after stopping treatment and never relapsed was likely to be cured, as you can see from the melanoma survival curve and the kidney cancer survival curve on the slide. So this was proof of principle that if the immune system was appropriately activated, it could eliminate the last tumor cell and cure the patient.
Slide 7
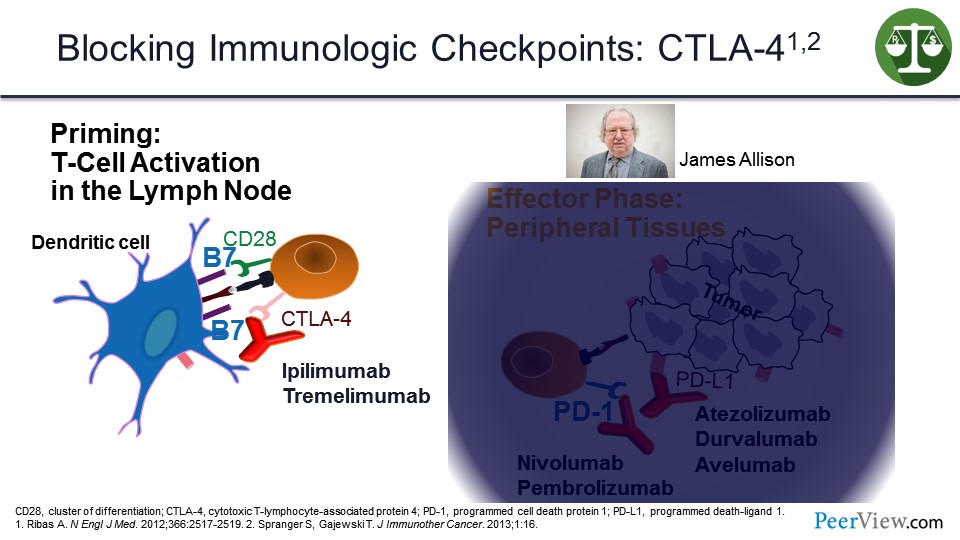
But IL-2 was an impractical therapy to give. It was too toxic, and it did not really work as well as we would have liked. And so, we spent a lot of time trying to figure out what was protecting the immune system from being fully activated, and the big discovery was the immune checkpoints.
The first of those was cytotoxic T-lymphocyte–associated protein 4 (CTLA-4) that works at the antigen-presenting phase to diffuse the immune system once it has been activated and to give antibodies, such as ipilimumab or tremelimumab, to block the interaction with CTLA-4 and its ligand on the antigen-presenting cell to reactivate the immune response. Jim Allison who discovered this won the Nobel Prize about 3 weeks ago for this discovery.
Slide 8
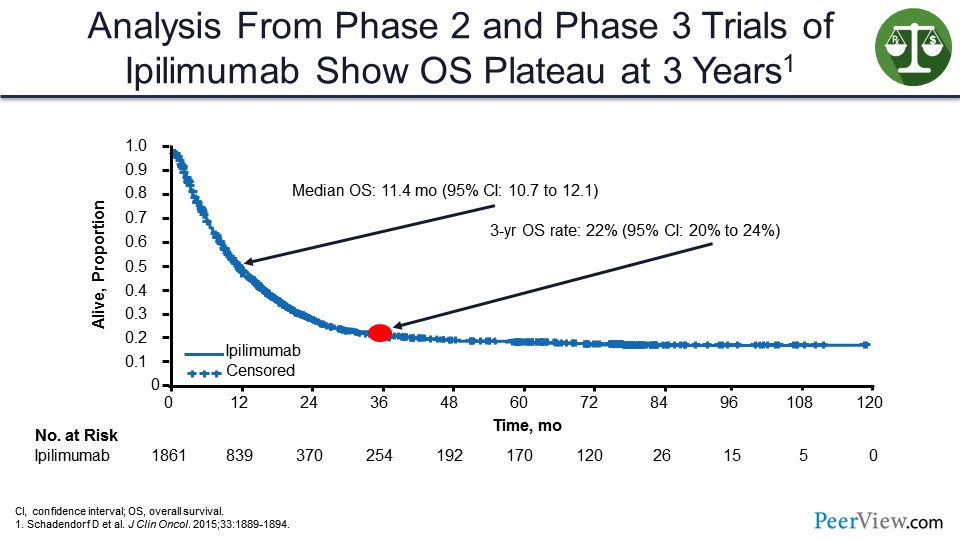
When you give ipilimumab to patients with melanoma, you can see a similar shape of a survival curve where even though the median overall survival (OS) is not prolonged all that much, you can see this tail of the survival curve where everybody who is alive at 3 years seems to be cured going out another 7 years.
Slide 9
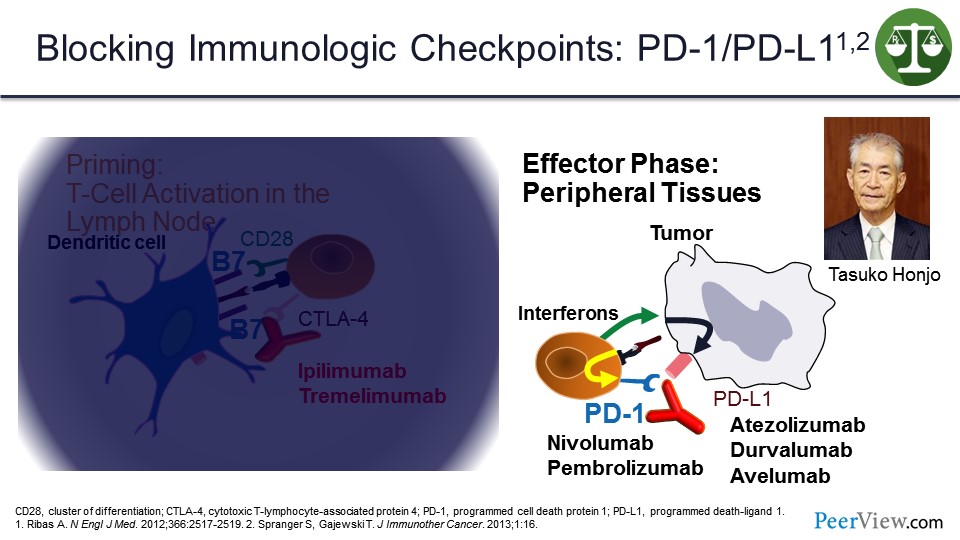
But the more important checkpoints were the programmed cell death protein 1 (PD-1) and programmed death-ligand 1 (PD-L1) that work in the tumor microenvironment. And it is important, because when T cells come into the tumor microenvironment and recognize antigens on tumor cells, they make interferons that upregulate PD-L1 on the surface of the tumor cells, which then can bind to PD-1 and shut off the immune response. This interaction was discovered by Dr. Honjo who shared the Nobel Prize with Jim Allison earlier this month.
There are a number of antibodies that are all United States Food and Drug Administration (US FDA) approved now in one setting or another that block that interaction, either by blocking anti–PD-1 or anti–PD-L1.
Slide 10
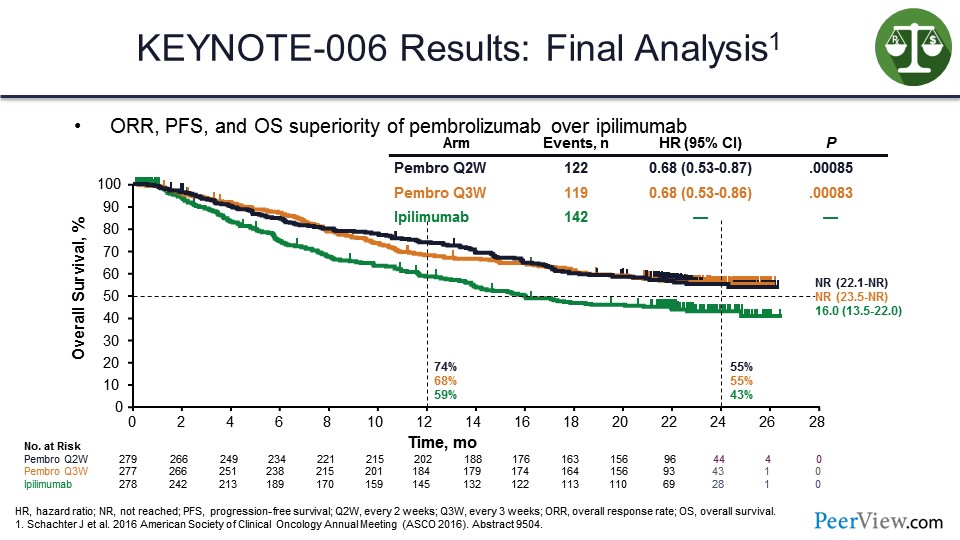
In studies looking at anti–PD-1s, and this is one of the first studies done with pembrolizumab in patients with melanoma, it was shown that pembrolizumab produces a tail on the survival curve that is above that seen with ipilimumab.
Slide 11
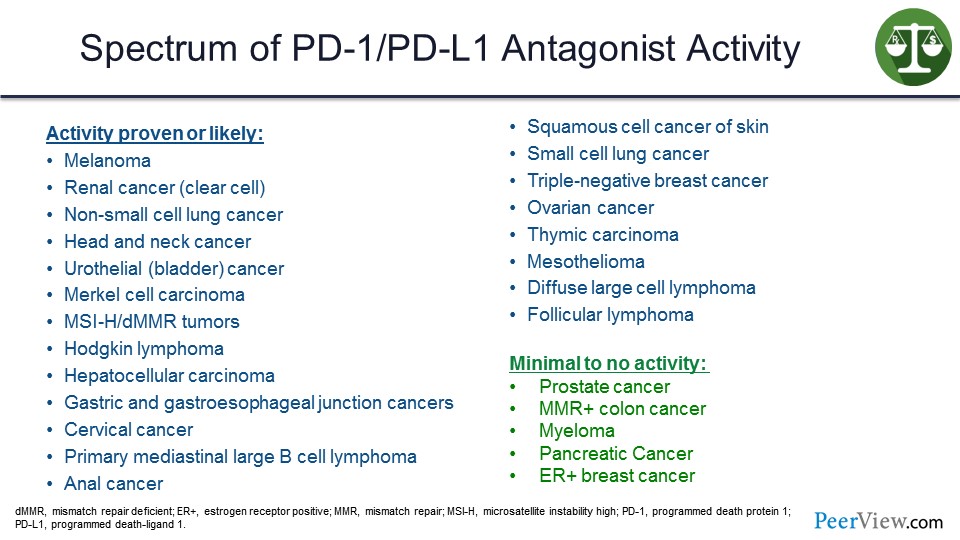
Now, the anti–PD-1s have shown activity in somewhere around 20 different cancers. The ones on the slide in red are US FDA approved based on phase 3 trials, and the ones in blue are US FDA approved primarily based on phase 2 trials with phase 3 trials likely pending. And it was of note that when you do an immunotherapy trial with a checkpoint inhibitor compared with a standard therapy, such as chemotherapy, almost all of them were positive for survival, because the principal impact of these agents is on survival.
But not all diseases, including some of the most common diseases that we see, respond to checkpoint inhibitor immunotherapy. We are still studying why some of these cancers evade the immune response, and how we can overcome some of those defense mechanisms.
Slide 12
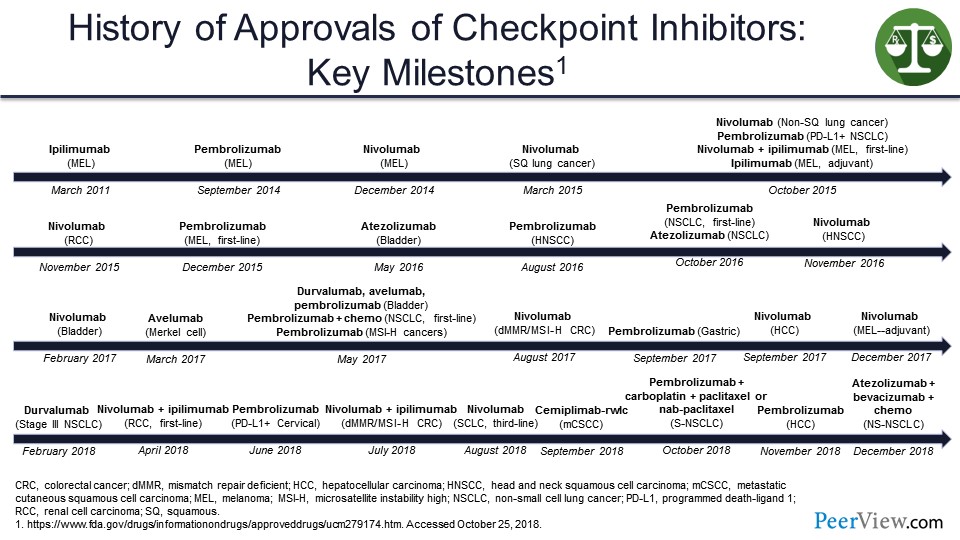
This slide shows a timeline for immunotherapy checkpoint inhibitors that starts in 2011 and gets very crowded over time with a virtual explosion of US FDA approvals that must make it very hard for pharmacists or even medical oncologists to keep track of all the stuff that is coming out.
Slide 13
Now I am going to talk about some of the areas where single agents are particularly useful, and where I see them going in the future—in particular, adjuvant protocols, biomarker refinement, and then combinations.
Slide 14
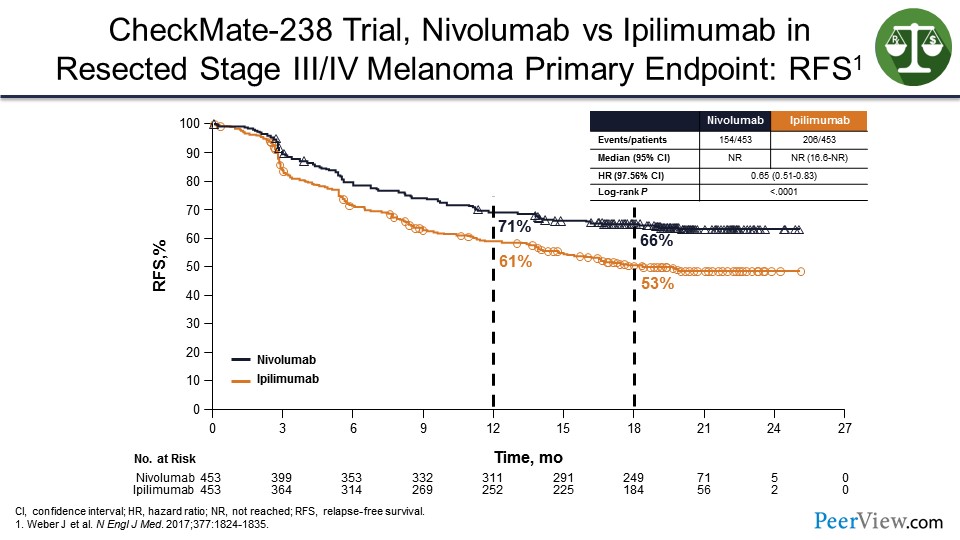
So in the adjuvant setting, we have similar data to that in the metastatic setting, where it seems that anti–PD-1s, in this case nivolumab, will prevent relapses better than ipilimumab. We know that ipilimumab is better than observation. And so, these agents will work even though you cannot see the tumor, because there is still a tumor microenvironment.
Slide 15
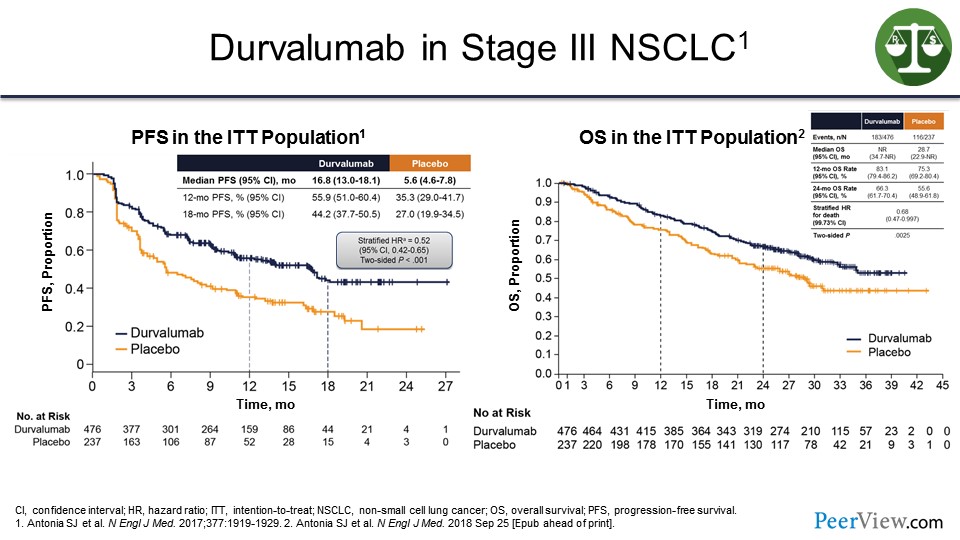
In addition, in the consolidation stage, such as in non-small cell lung cancer—and these are data with durvalumab given in patients with stage III cancer after chemotherapy and radiation—if you gave durvalumab versus observation, you can see improvement in progression-free survival (PFS) and OS.
What this suggests is that these agents will work in the adjuvant setting. And I predict in all of those 20 diseases or so where there is activity, there is going to be a shift toward moving these agents earlier into the disease setting, which means a lot more patients are going to receive these treatments including many patients who may never relapse, just have a risk of relapse.
Slide 16
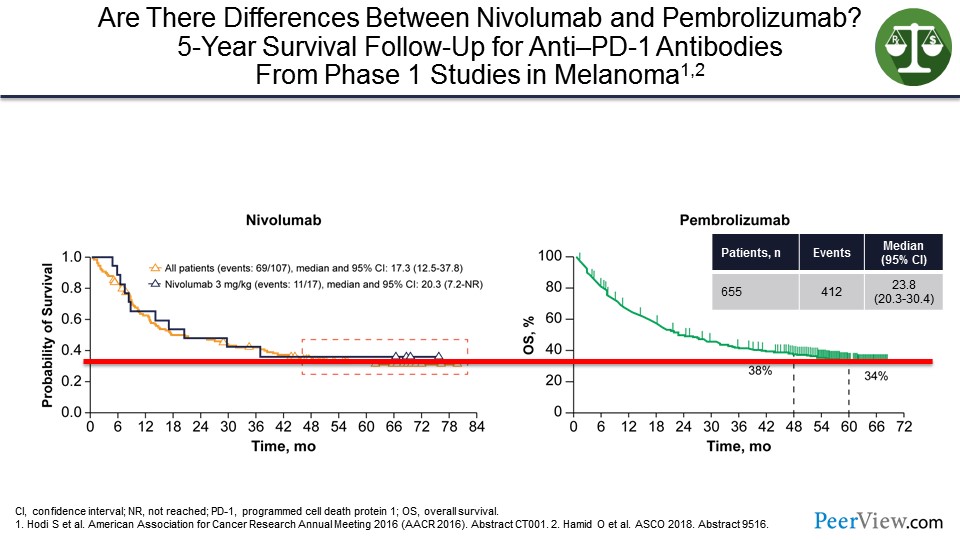
I have talked about pembrolizumab and nivolumab. Are they different? They are both anti–PD-1s. And you can see on the slide that at least in patients with melanoma, if you look at where the tail of the survival curves sits from some of the early studies, they look very similar with having about a 35% cure rate.
Slide 17
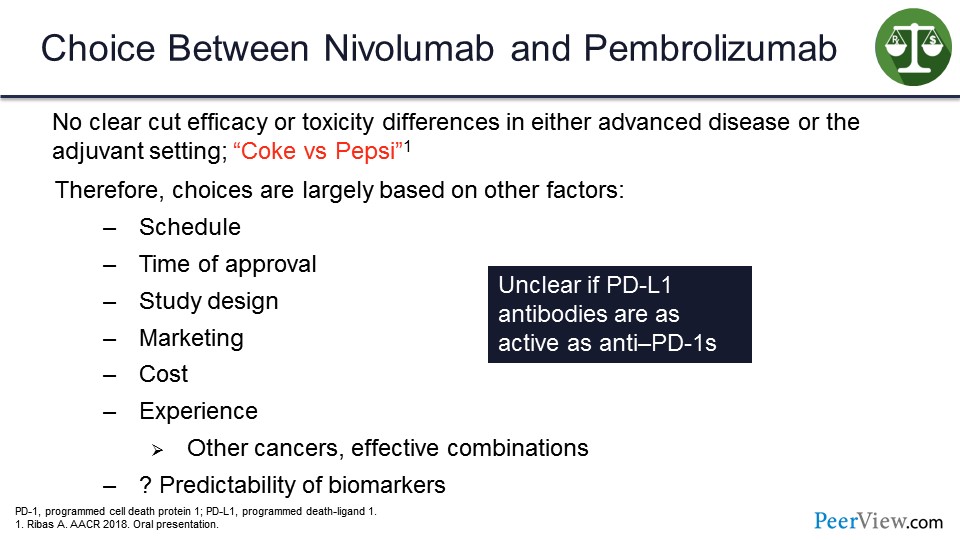
There is really no clear-cut difference either based on toxicity or activity between pembrolizumab and nivolumab in either the advanced disease or adjuvant setting. Toni Ribas said: ”Either Coke or Pepsi.” And, therefore, the choice of which one someone should use is based on other factors such as schedule, time of approval, study design, marketing efforts, presumably possibly costs, the experience of the physician, where the trial was done, in what setting and in what setting the approval is, and the predictability of the biomarkers in that particular setting.
And so, I think, we use these treatments in one setting versus the other not because the other treatment would not work, but because there are not enough data or because we are more comfortable with one agent or another. And right now, although the anti–PD-L1s are also efficacious, it is unclear, and there have not been any head-to-head comparisons to know whether they are as effective as the anti–PD-1s.
Slide 18
Can we identify the population that will benefit the most or will not benefit from an anti–PD-1 monotherapy? In order to do that, we need biomarkers. One of the biomarkers that we hear a lot about is PD-L1 expression. When it is induced by immune cells trying to attack the tumor, we see it on the surface of the tumor cells, and it shuts off the immune system. So it stands to reason that if a tumor is making PD-L1, there are T cells there that are trying to kill it.
Slide 19
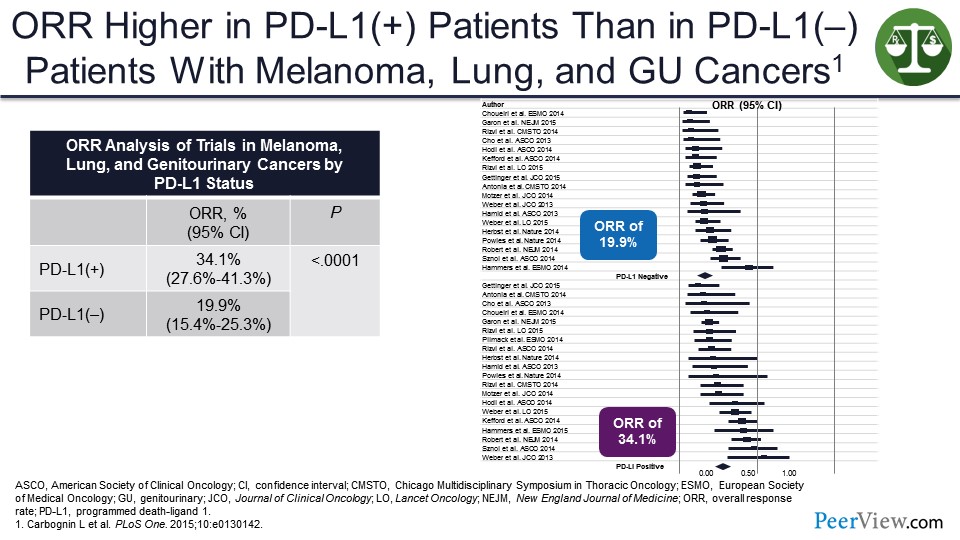
In consolidated efforts, we can see that the response rate in PD-L1–positive tumors is usually higher than in PD-L1–negative tumors. So it is a way of enriching for response. But the problem is in most of these studies, there is still a fair amount of activity in the PD-L1–negative population, and this may be the only way to cure those patients.
Slide 20
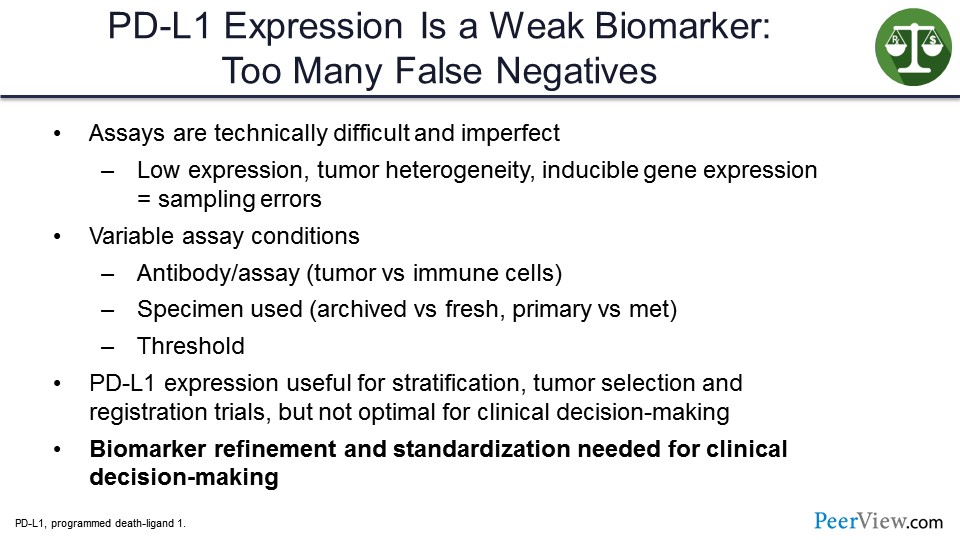
I think PD-L1 expression has to be considered a weak biomarker. There are too many false negatives. The assays are technically difficult. They are imperfect. In one setting, using one assay you may call a tumor PD-L1–positive, and then, using another assay, it may be PD-L1–negative. And so, there is no such thing as an absolutely PD-L1–positive tumor. The specimens used could make a difference—whether it is fresh or archived, whether it is primary or a met. The threshold used for calling positivity can also make a difference.
So, in my view, PD-L1 expression is used for stratification. It is useful for tumor selection, for which one should go to registration, for which ones we should study, and for registrational clinical trials to try to show that an agent is better than the standard of care with more convincing results. But they are not at all useful for clinical decision-making, for example when you are seeing a patient who, even though their tumor is PD-L1–negative, standard of care may still be their best therapy. And so, biomarker refinement and standardization are needed for clinical decision-making.
Slide 21
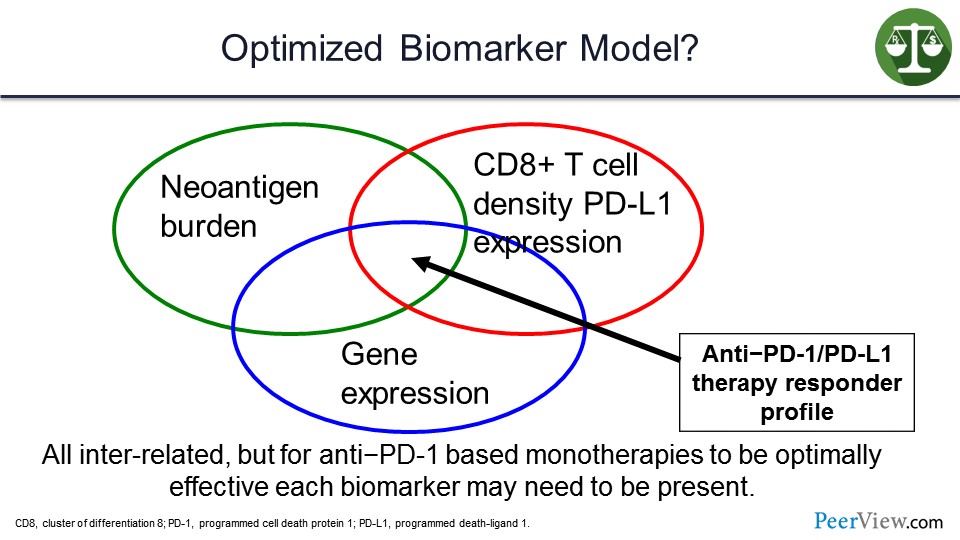
In my view, this is going to involve more complex biomarkers such as looking at neoantigen burden, gene expression profiles for inflamed tumor microenvironment, and the presence of not just PD-L1 but cluster of differentiation 8 (CD8) T-cell density and the clonality of those T cells in the microenvironment. Additionally, the tumors that will respond to a single agent will likely have some overlap between those particular biomarkers.
Slide 22
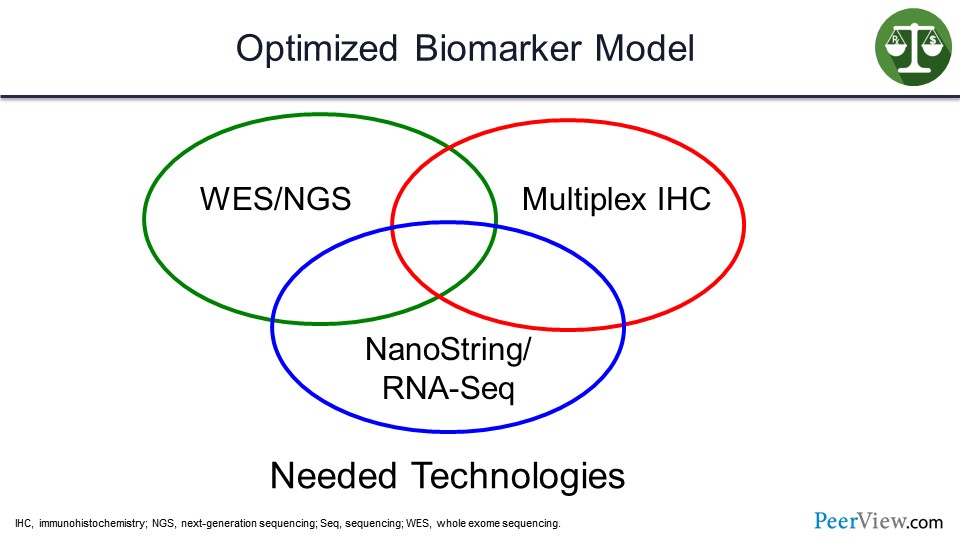
In order to do these assays, you need whole-exome sequencing or next-generation sequencing, multiplex immunohistochemistry, and NanoString. These are hard for many community hospitals to have, so I think there will be a move towards sending tissue to diagnostic labs.
Slide 23
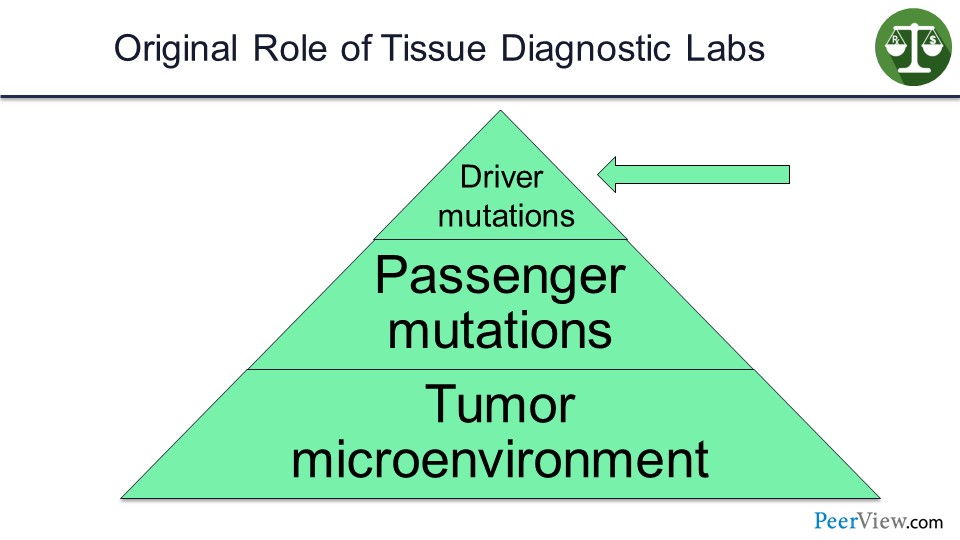
These diagnostic labs were set up—for example, the FoundationOne, the Caris, et cetera—to identify driver mutations in tumors that could be targeted.
Slide 24
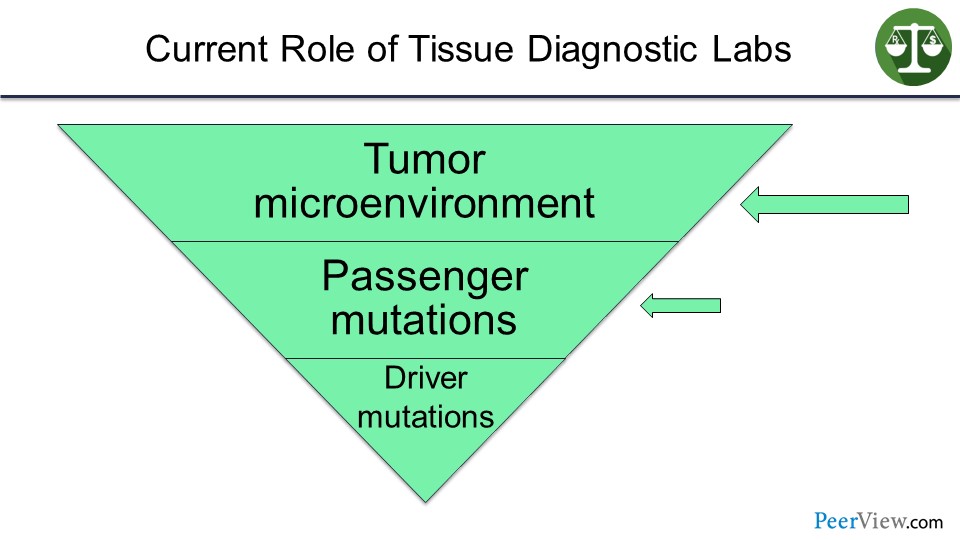
But I envision that in the not-too-distant future, their business model—because they are going to own these tumor specimens—will be to look at the tumor microenvironment and passenger mutations, and then try to understand how that particular tumor is escaping the immune system, so that the oncologist can prescribe the right combinations of immune therapies in order to help that particular patient. So I am going to move now quickly to combination immunotherapies.
Slide 25
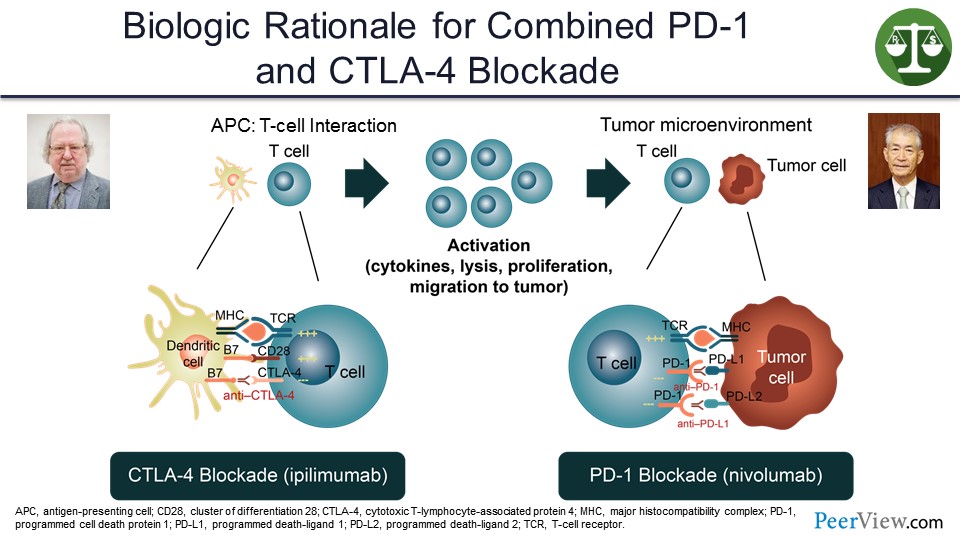
And, to me, the best combination of actual immune therapy so far and the only one that has really shown survival benefit is combining CTLA-4 and anti–PD-1—putting these two Nobel Prize–winning discoveries together in a combination.
Slide 26
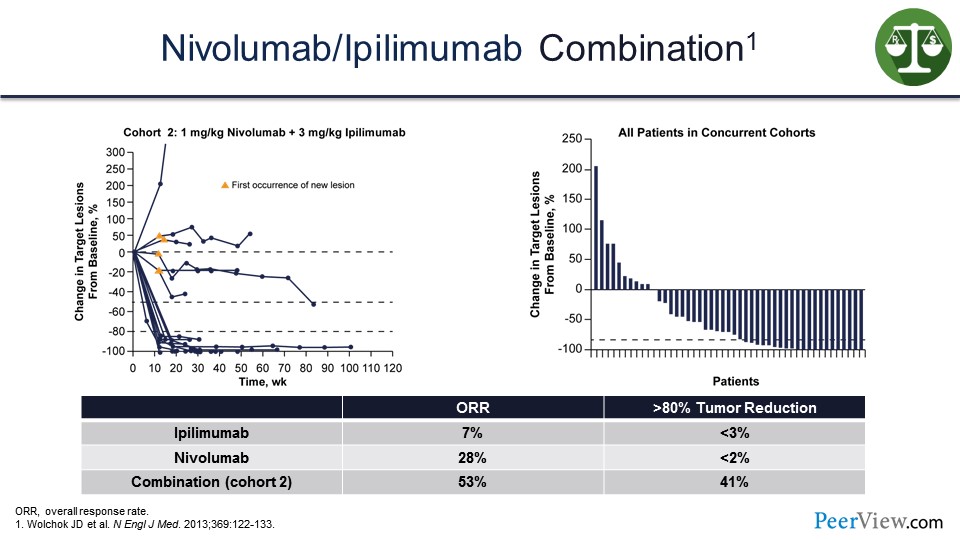
And in the initial studies that we did with ipilimumab and nivolumab, we saw this rapid tumor shrinkage and a high degree of tumor shrinkage with over 50% of patients on this waterfall plot, presented on the slide, showing tumor shrinkage and response.
Slide 27
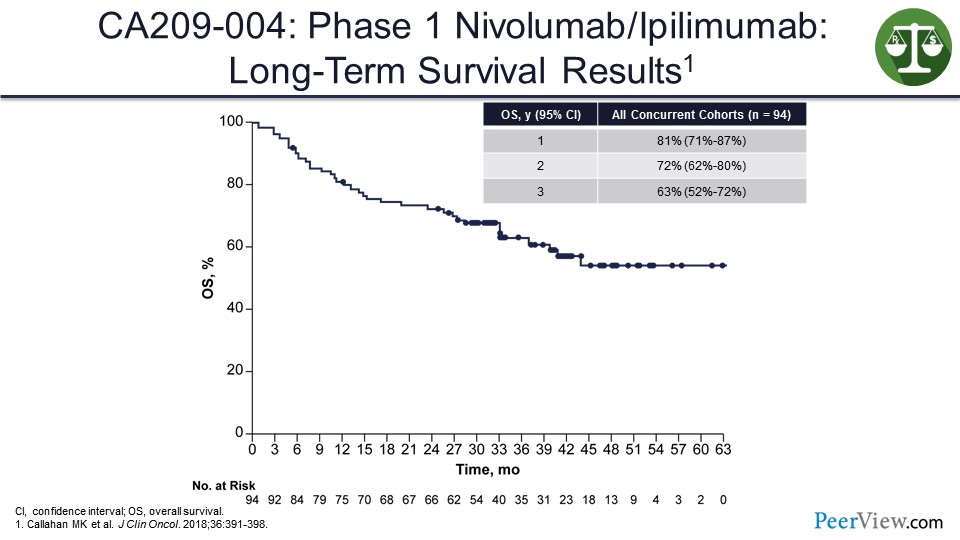
And what we saw looking at the tail of the survival curve in our first phase 1 study, even though these patients were previously treated, was over 50%, in the 63% range.
Slide 28
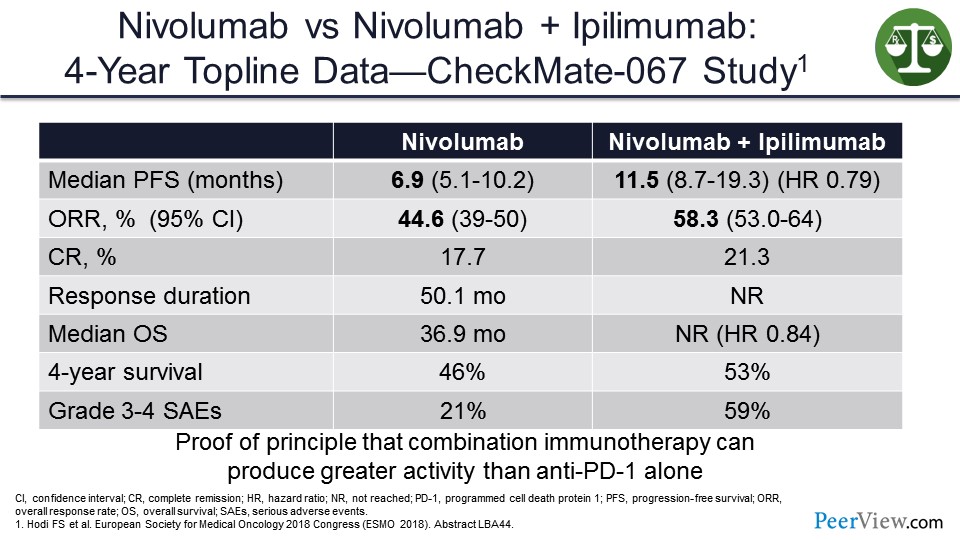
In the CheckMate-067 study that looked at nivolumab/ipilimumab versus nivolumab alone, the median OS was approaching statistical significance in favor of nivolumab/ipilimumab versus nivolumab alone. And, to me, this was proof of principle that combination IO can produce activity that was greater than anti–PD-1 alone.
Slide 29
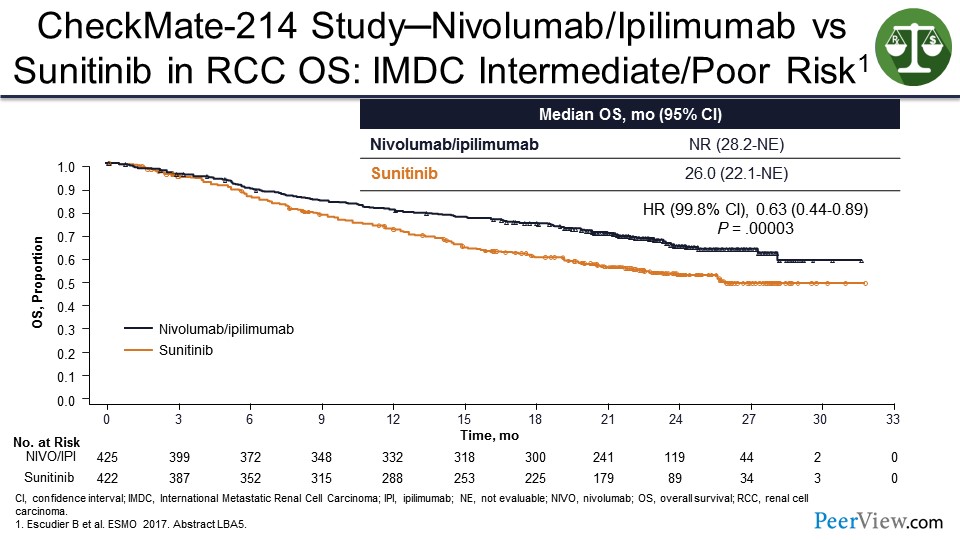
You can see this in other diseases besides melanoma. In CheckMate-214, nivolumab/ipilimumab shown benefit over sunitinib in patients with kidney cancer—thus, leading to the US FDA approval. And it looks like there is going to probably be a tail on the survival curves for the nivolumab/ipilimumab arm that is going to be around 40%.
Slide 30
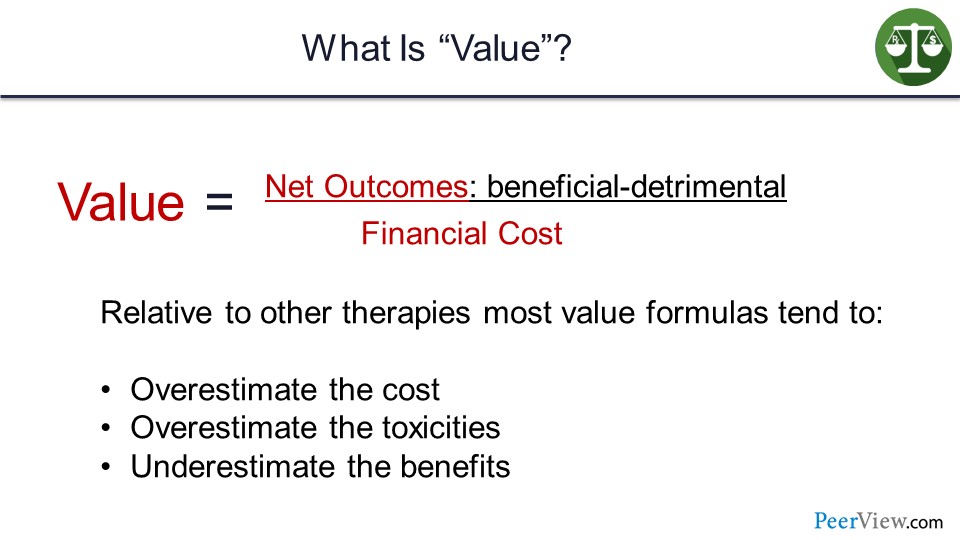
I am going to talk now about value. Value was defined as net outcomes, which are benefits minus detriments over financial cost. And relative to other therapies, most value formulas tend to overestimate the cost and the toxicities, and underestimate the benefits.
Slide 31
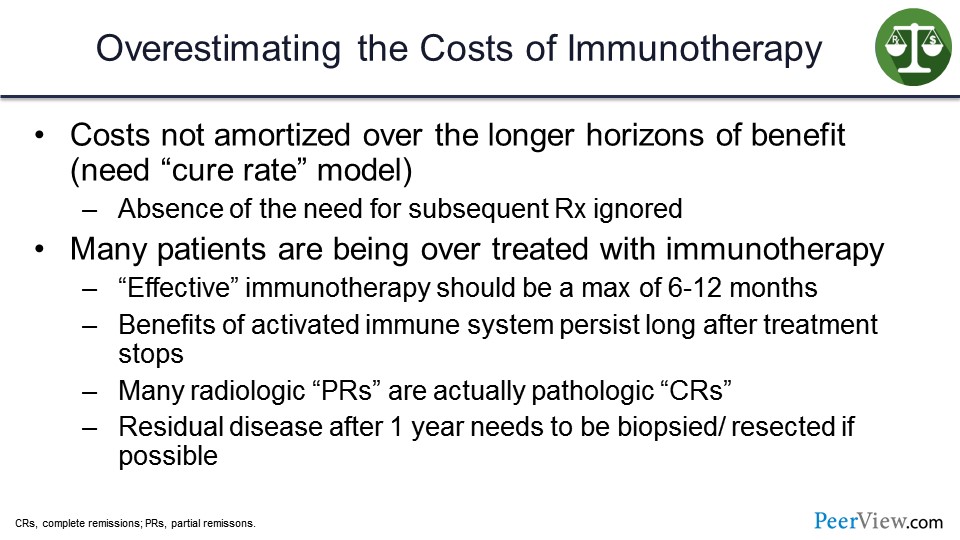
In terms of overestimating the cost, the costs are not amortized over the longer horizons of benefit. In order to do that, you need a “cure rate” model that goes beyond the confines of that clinical trial publication. Oftentimes, the absence of the need of subsequent therapy is ignored. The fact that these patients are cured and that the tail of the survival curve may go out decades are not considered.
Many patients are actually being overtreated as well. In my view, effective immune therapy appropriately applied should be able to eliminate a tumor within 6 to 12 months. The benefits of an activated immune system can persist long after the treatment stops, so people should not be concerned about stopping treatment after a period of time, giving the immune system a chance to work.
Many radiologic partial responses are actually pathologic complete responses, and, therefore, those patients really do not need to be treated. We are just throwing money away when we are giving them therapy.
Residual disease after 1 year, in my view, needs to be biopsied and resected if possible. And we need to find out if there is active disease there and how that disease is escaping the immune system in order to modify the treatment.
Slide 32
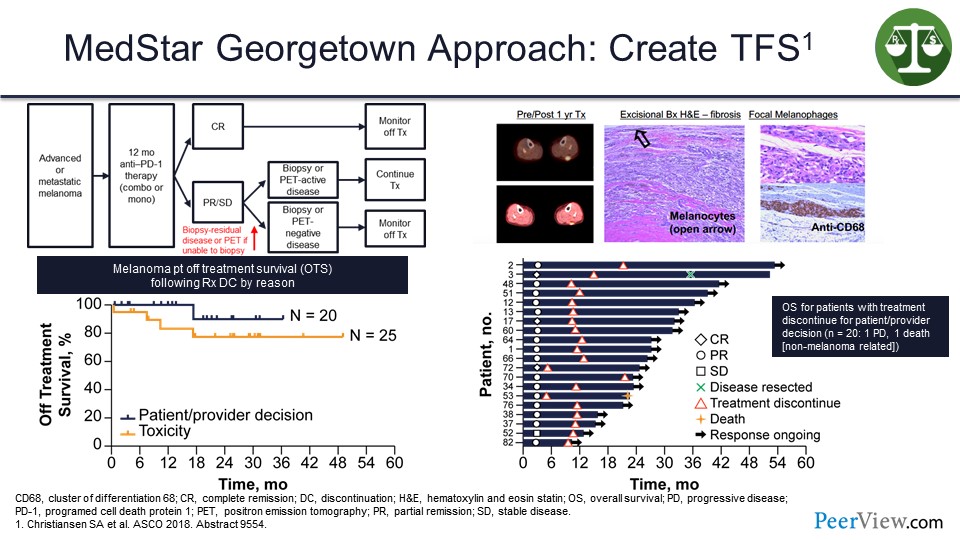
At our institution, we have been taking patients with melanoma and if they are still on therapy at a year, we do a computed tomography (CT) scan. If the CT scan shows no disease, we stop. If the CT scan shows disease, we do a positron emission tomography (PET)/CT scan. If that shows no metabolic uptake, we stop, but if the PET scan is positive, we biopsy the residual disease.
And about 9 out of 10 times in melanoma, there is no tumor present. What is keeping that PET scan active is an immune reaction probably against the antigen being presented by macrophages in the tumor microenvironment. These are actually pigment-laden macrophages here in the tumor microenvironment. Then we stop the treatment, and if we stop the treatment either because of toxicity or electively, most of those patients will continue on response without needing additional therapy.
This is a swimmer’s plot (Slide 32), and we have only had one patient who has relapsed in this setting, out of the 20 or so patients in whom we stopped treatment voluntarily.
And that patient had their disease resected and remained free of disease for 2 years afterwards, but the patient died from a different cancer. And so, we have never had to give another dose of systemic therapy to these patients.
Slide 33
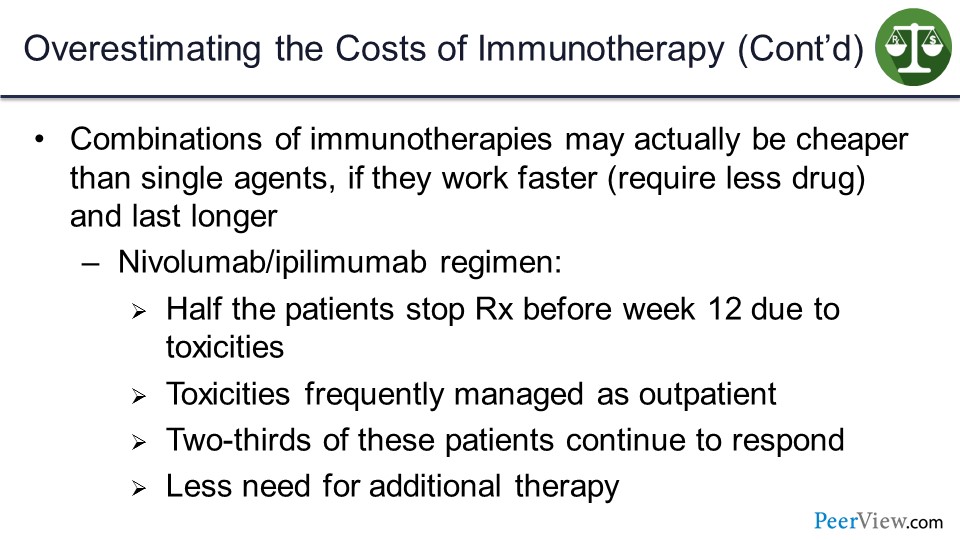
So, combinations of immunotherapy therapy may actually be cheaper than single agents if they work faster, require less drugs, and last longer. So the nivolumab/ipilimumab regimen, half the patients stopped treatment before week 12 due to toxicities, but the toxicities can be managed in an outpatient setting. Two-thirds of these patients continued to respond, and very few patients needed additional therapy after responding. Seventy percent to 80% of those patients who have toxicity will continue to respond without additional therapy. In the patients who we electively stop, it will be close to 90%.
Slide 34
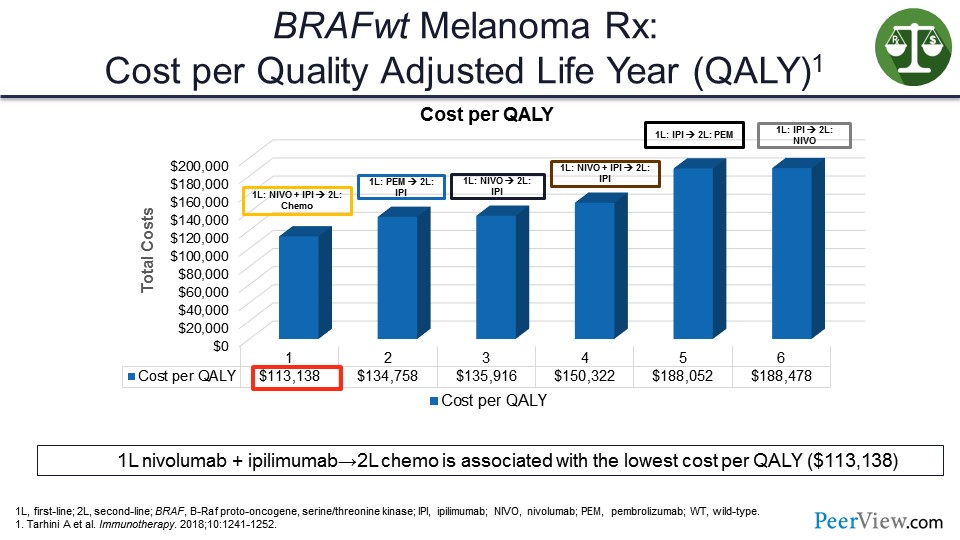
So in this analysis that we did, which was just published in Immunotherapy, you can see that when you look at quality-adjusted life years (QALY) and the cost per QALY, that the combination therapy in the first line actually turned out to be cheaper than starting with a single agent and then having to give salvage therapies.
Slide 35
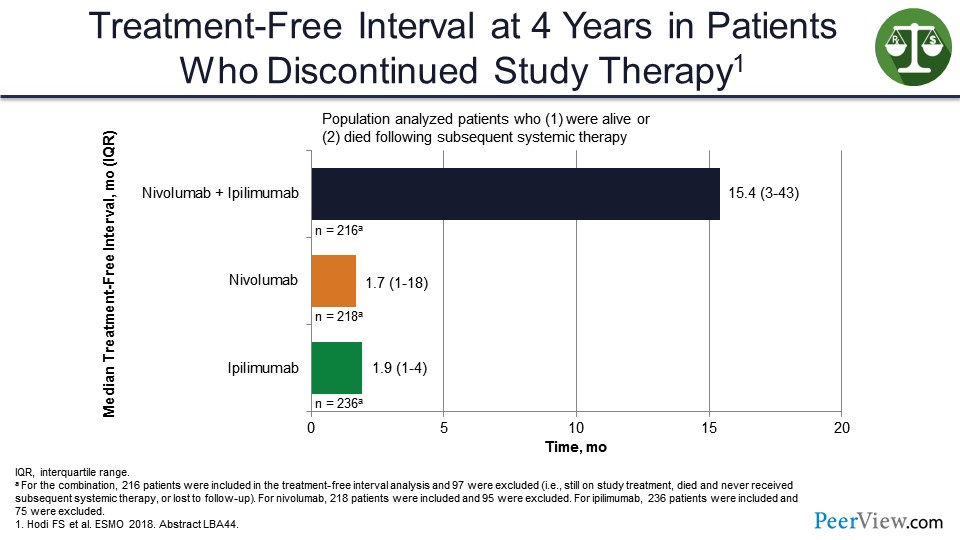
And that is because of this long treatment-free interval that we see with the combination compared with single agents, which actually would go out even further and would be even longer if the study had allowed for patients on the combination arm to stop treatment at 1 year.
Slide 36
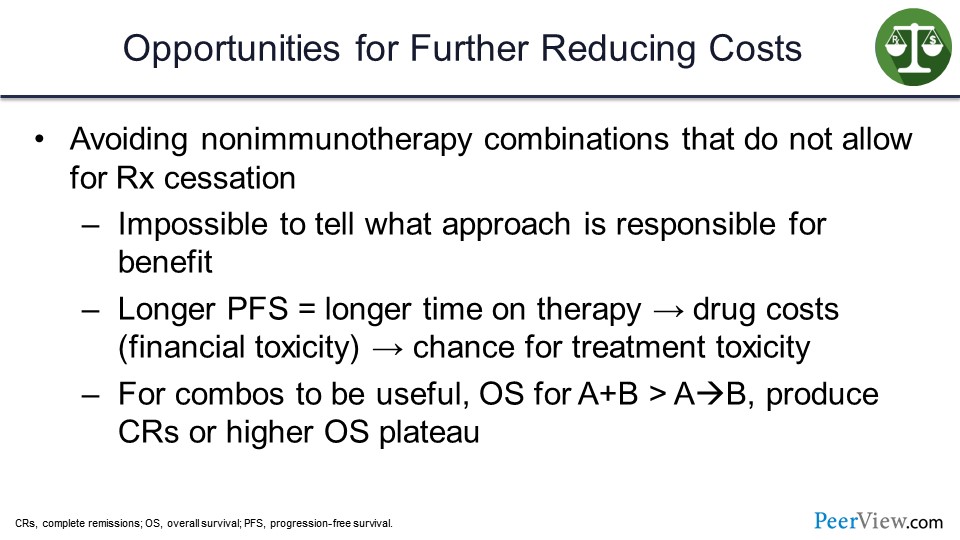
So what are the opportunities for further reducing costs? We can try to avoid nonimmunotherapy combinations that do not allow for treatment cessation. Now I am preaching a little bit here, but when we combine two different treatment approaches, it is impossible to tell what approach is responsible for the benefit. The longer PFS actually means longer time on therapy, more drug costs, more financial toxicity, and more chance for treatment-related toxicities for the patient.
And in my view, for combinations to be useful, the combination has to be better in terms of OS than the sequence of the two agents. It has to produce more complete responses and have that treatment-free survival (TFS) where you can stop treatment and the benefit persists. And my problem with these studies is very few of them actually have been designed with that view in mind or looked at that as an endpoint. They look at more traditional endpoints, such as PFS.
Slide 37
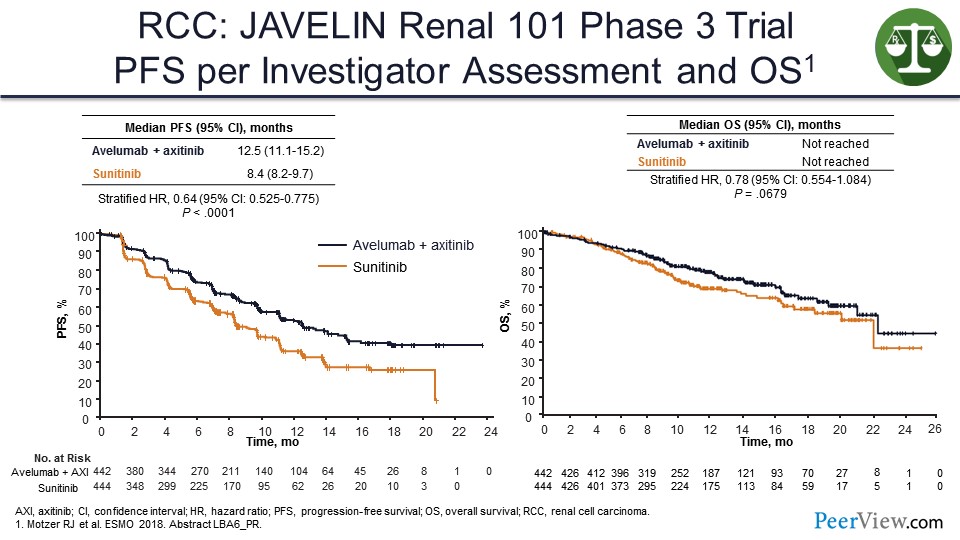
One example is a study that was presented at the European Society of Medical Oncology 2018 Congress earlier this week and received a lot of publicity—the JAVELIN 101 study in kidney cancer looked at axitinib plus avelumab in patients with kidney cancer compared with sunitinib. You can see that there is an improvement in PFS, but it is hard to see that it is actually translating into much of an improvement in terms of OS. And even at 18 months, the PFS curve is still going down and below where we would expect it to be with a pure immunotherapy regimen like nivolumab/ipilimumab.
Slide 38
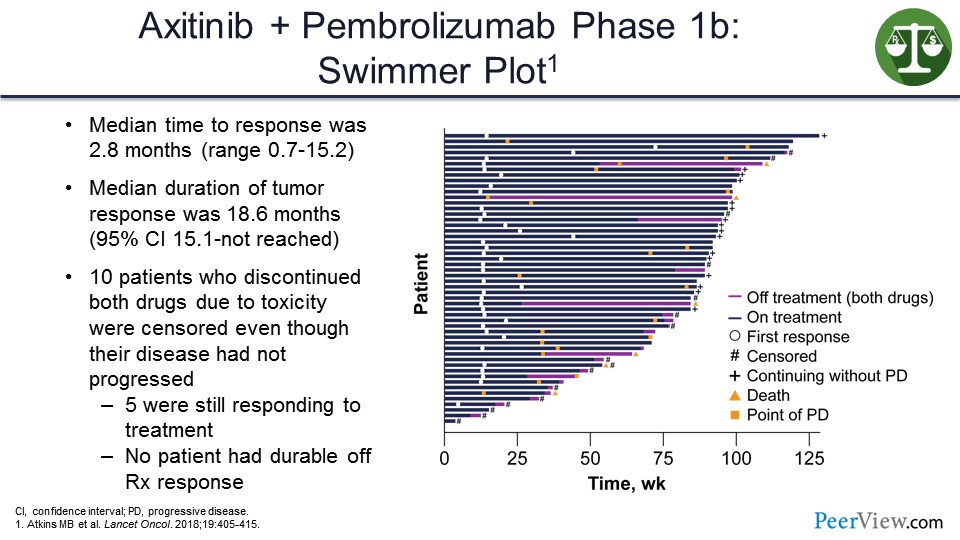
In another study, on which I was the first author, looking at axitinib/pembrolizumab—which was also announced to be positive earlier this week in terms of PFS and OS—we can see in this swimmer’s plot (Slide 38), that the way the study was designed if you stopped treatment, you were censored. Because of that, we cannot see in that study whether any of the patients who stopped treatment continued to respond.
Slide 39
Another approach to reducing costs would be reducing drug waste. This is estimated to be billions of dollars a year. It is nice that a lot of these drugs have gone to flat dosing, which makes it easier for, I think, not throwing a drug away. But reducing drug administration costs and markups, which are tremendous at hospitals, are other ways of reducing costs, and, of course, using biomarkers. So selecting the right drug or combination for the patient is also an important part of keeping the cost of these agents down.
Slide 40
I think we also overestimate the toxicity. I hear a lot of my colleagues who did not grow up in the IL-2 era talk about how toxic these agents are and that patients can get these immune-related toxicities. But the toxicities are usually short-lived, less than 4 weeks, and they are associated with response and survival benefit, as I have shown.
And when people are talking about toxicities, they do not talk about the big toxicity that I worry about is the toxicity caused by the cancer not being cured. The biggest toxicity is any decrement on the tail of the OS curve. And so, I think there are opportunities that also exist to reduce toxicity, such as using less ipilimumab, potentially substituting less toxic agents for ipilimumab, or better management of toxicities through education.
Slide 41
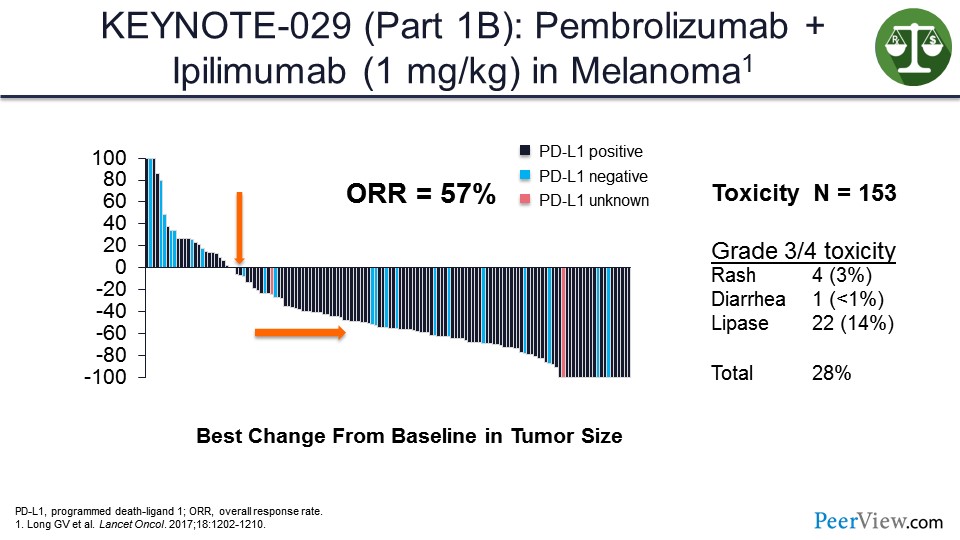
This slide presents data from the KEYNOTE-029 study that looked at pembrolizumab at full dose and ipilimumab at a lower dose, and showed activity similar to what was seen with the ipilimumab/nivolumab at the full combination but with the less toxicity overall.
And these data will be updated within the next couple of days at the International Congress of the Society for Melanoma Research. The 3-year OS data, which I will not give, is really startling for this combination, so pay attention to that.
Slide 42
There is also, I think, an underestimation of the benefits of immunotherapy. The time horizons need to account for the long duration of benefit, including the TFS. And these provide significant benefit to patients and also benefits to their family and their work colleagues.
Slide 43
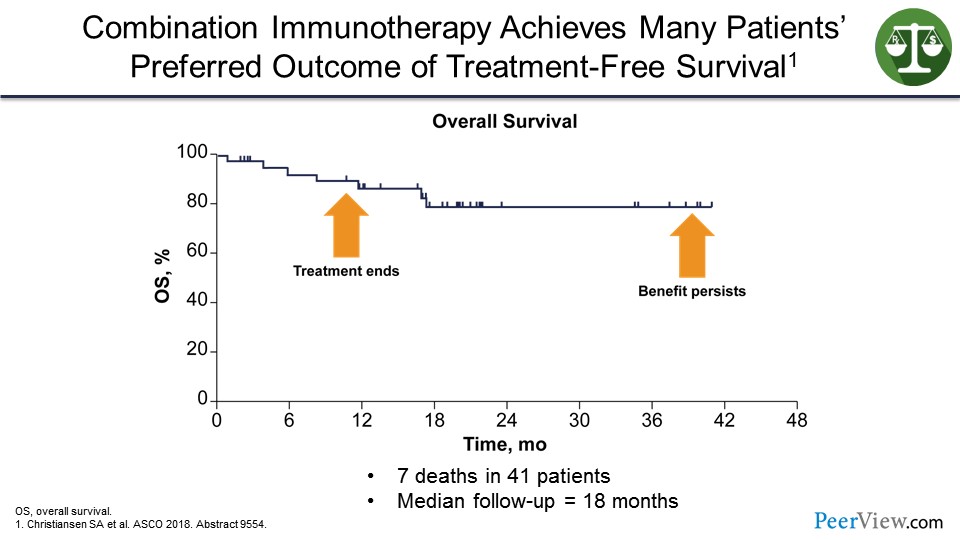
So immunotherapy has turned my melanoma clinic into a virtual travel agency, where the treatment ends but the benefit persists.
Slide 44

And, therefore, my patients have been traveling around the world. They tell me about all the places they have been able to go on their bucket list and all their life milestone events that they have been able to attend (including attending Fenway Park), because the treatment has been stopped and they have been unleashed from the oncologist's office. So this TFS, as we have renamed it to be “travel-full survival.”
Slide 45
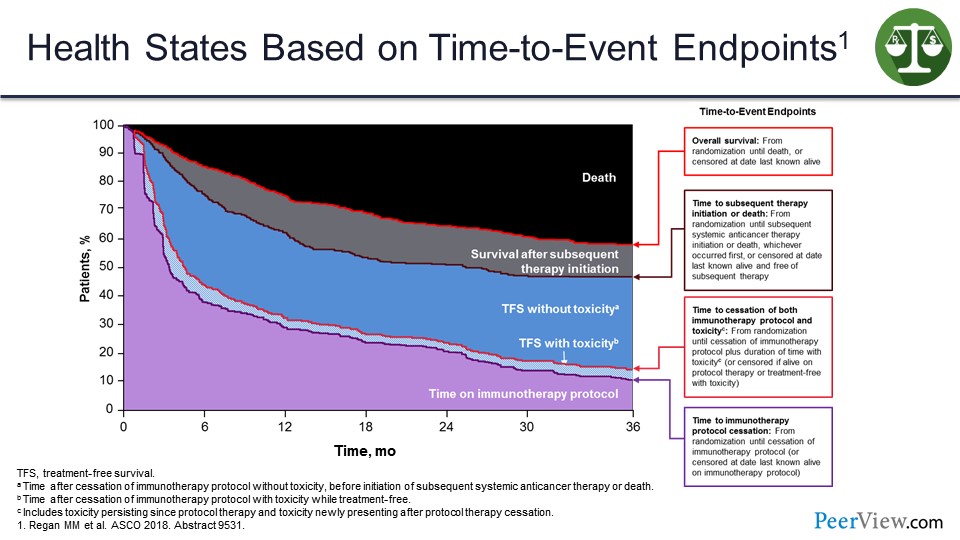
We have tried to create a model that looks at this based on the area of a 3-year time point, and how much is spent in various time states. So this is the OS curve. These are the time on treatment and time to treatment cessation curves. This is the time to subsequent therapy curve. And then I am filling it in with areas.
You can see TFS without toxicity is in blue. The toxicity itself is that lighter blue, and this black area at top is time spent in death.
Slide 46
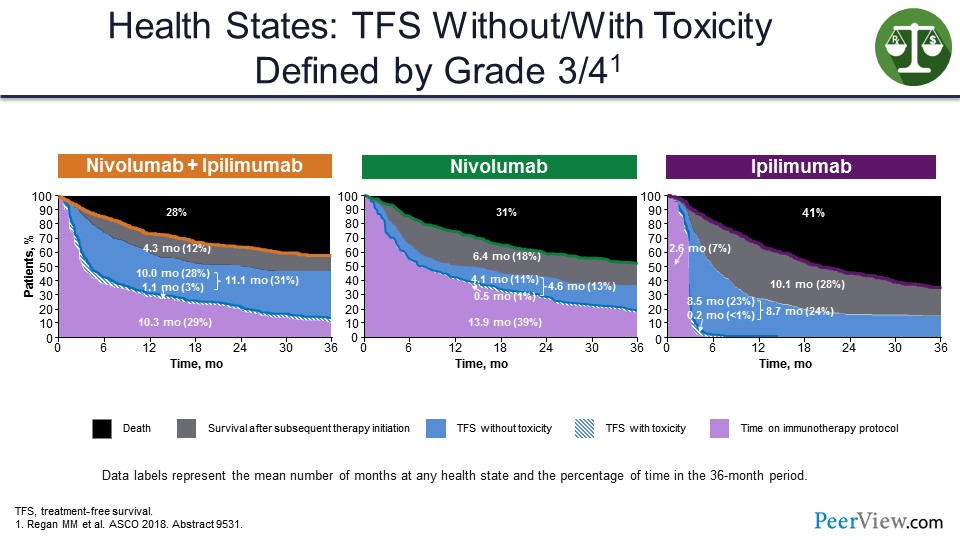
And so, if you look at how these different regimens compare, looking at it this way, you can see that only 3% of time, 1.1 months on average for nivolumab/ipilimumab, is spent during toxicity. And most of it is spent here in this blue area that is a lot bigger than the blue area shown for monotherapy. And we would make this blue area bigger if we stopped therapy at 12 months in all patients.
Slide 47
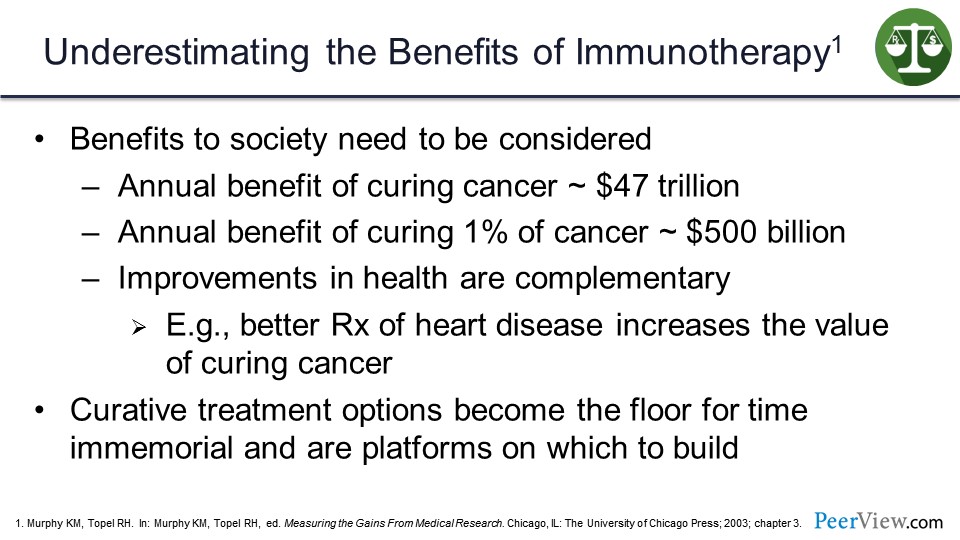
So the benefits to society need also to be considered. The annual benefit of curing cancer was estimated in the late 1990s to be $47 trillion. The annual benefit of curing just 1% of cancer is about $500 billion. And improvements in health are complementary, so if you get better treatment of heart disease, it increases the value of curing cancer. And for curative treatments, the options become the floor for time immemorial. And they are platforms in which we can build future therapies.
Slide 48
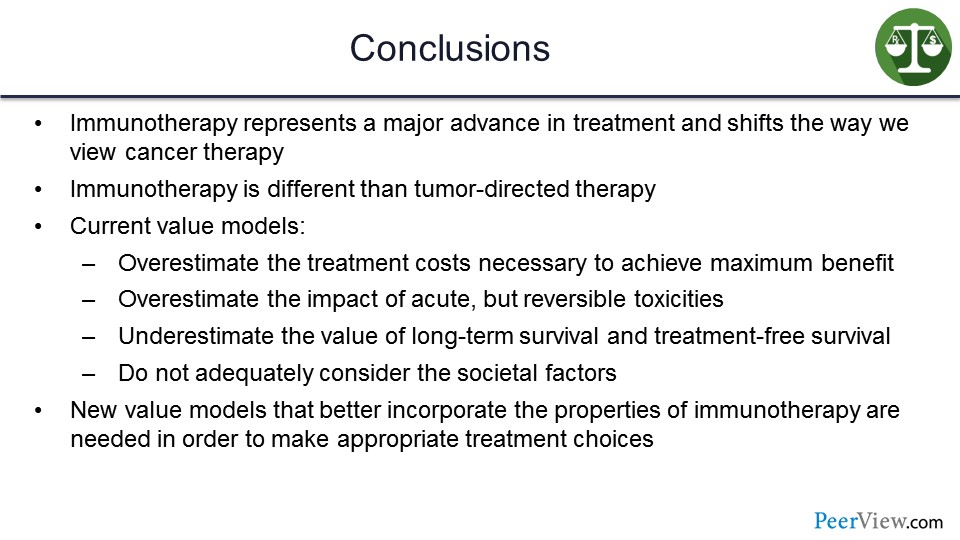
In conclusion, immunotherapy represents a major advance in the treatment of cancer and a shift in the way we even think about cancer biology. And immunotherapy is different than tumor-directed therapy. In my view, current value models overestimate the treatment costs necessary to achieve maximum benefit and overestimate the impact of acute but reversible toxicities, as well as underestimate the value of long-term survival and the TFS. Moreover, current value models do not consider adequately societal benefits.
Therefore, I think new value models that better incorporate these properties of immunotherapy are needed in order to make appropriate treatment choices.
How to Fit Immuno-Oncology Into the Value-Based Care Delivery Model: Latest Research and Recommendations for Managed Care Professionals
Slide 49
Dr. Kenney: So, I am going to talk about fitting IO into the value-based care delivery model and recommendations for managed care professionals. And what I am going to talk about specifically is this concept of value, and where we are seeing it in so many different areas of the business on the health plan side and the managed care side as it relates to IO and oncology in general.
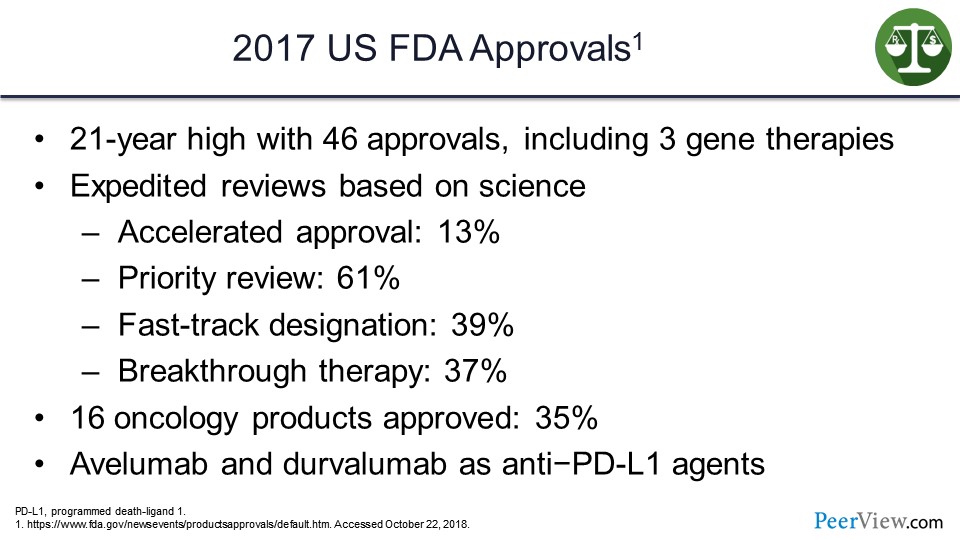
So why all the excitement? Why all this talk about value? Well, if we look at the US FDA approval ratings and quantity of drugs approved in 2017, we had 46 drugs approved, including three gene therapies, that is a 21-year high. And what we are seeing as a challenge today is a lot of these drugs are being approved with very rapid response, if you will, from the US FDA—drugs designated with accelerated approvals, priority review, fast-track designations, or breakthrough therapies.
I mean, there are so many of these now that from a formulary management perspective, you almost do not react perhaps as aggressively as you might to these, because it seems to be a very common response from the US FDA in terms of labeling them. But you can see significant percentages of products achieving these special designations.
And in 2017, we had 16 oncology products, so about one-third of the products approved were in the oncology space, including avelumab and durvalumab as anti–PD-L1 agents in IO. There is a lot of activity with products here that we need to figure out how we are going to extract good value out of this system.
Slide 50
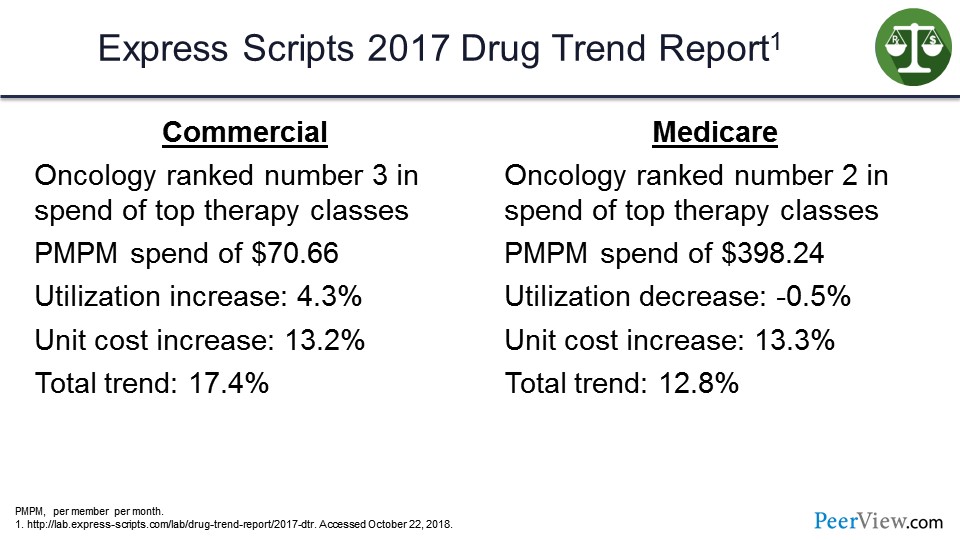
If we look at the Express Scripts Drug Trend Report for 2017, oncology on the commercial side was ranked number three in total spend. It was one of the top therapy classes, with a per-member per-month spend (PMPM) of $70.66. Utilization increase in that category was about 4%, and the unit cost increase was about 13%. So the driver trend there was over 17%.
On the Medicare side, no surprise, oncology is ranked number two, with a PMPM spend of $398, almost $400. There was actually a utilization decrease but a cost increase, so, again, total trend there about 13%—so a lot of new drugs and also a lot of trends in terms of spending and utilization in the oncology category.
Slide 51
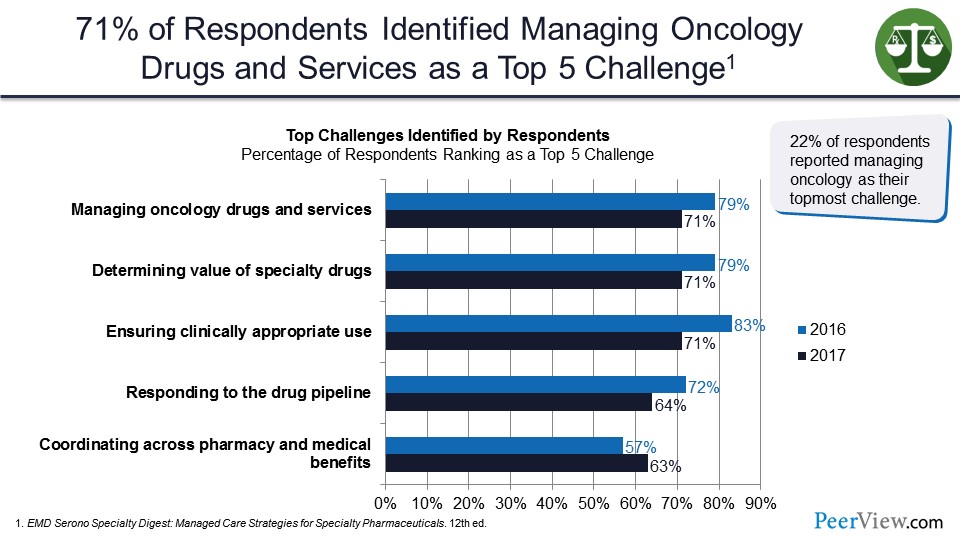
These are data from EMD Serono Specialty Digest that looked at respondents in the health plan and insurance settings. How did they view managing oncology drugs? And what are the top five challenges? And we see here we have managing oncology drugs and services at the top of the list. Determining value of these drugs is in second place with 72% of respondents. And third is ensuring clinically appropriate use, responding to the drug pipeline, and coordination across the pharmacy and medical benefit, as I mentioned earlier.
So 22% of respondents reported managing oncology as their topmost challenge. As you would expect, being in the top three category for utilization and cost, one that the health plans are really struggling with to try to figure out how do we manage this.
Slide 52
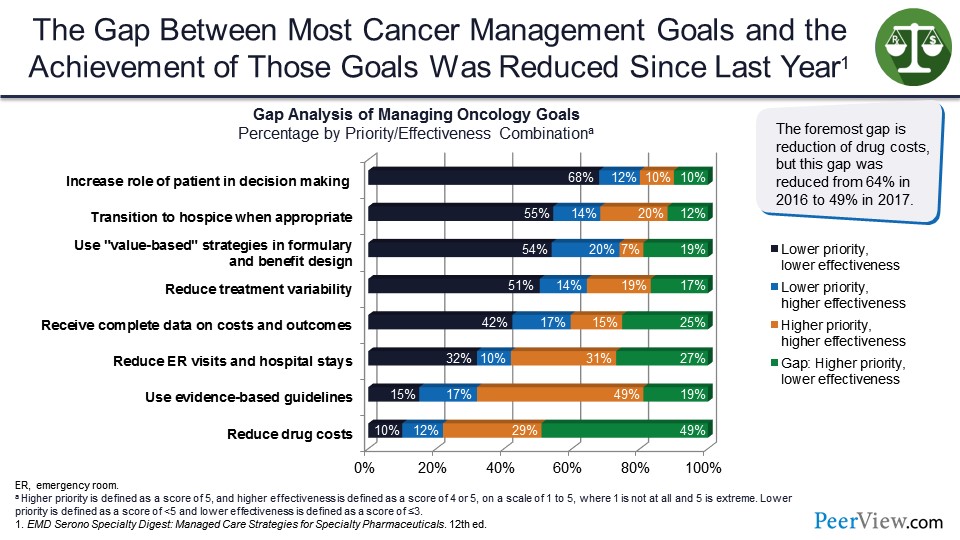
The gap between most cancer management goals and achievement of those goals was reduced. These are 2016 to 2017 data. And the gap piece is showing a higher priority but a lower effectiveness. And we see here reducing drug costs is about 50%.
But at the top, we see the increased role of patients in decision-making is interestingly a lower priority and a lower effectiveness. And so, we have some real gaps, if you will, in terms of where do we need to target our approach to achieve better outcomes.
Slide 53
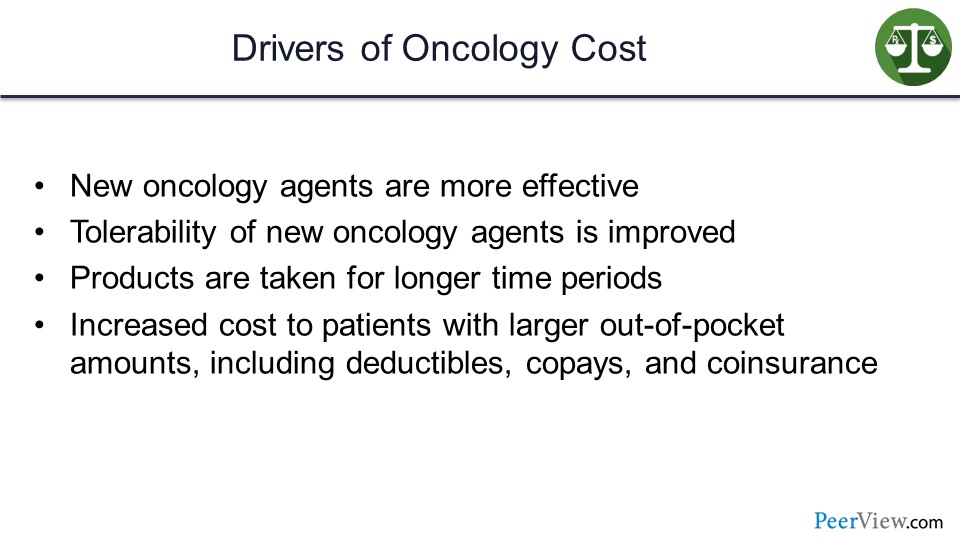
What is driving oncology costs here? Clearly, new agents are more effective. Tolerability is improved. Products are taken for longer periods of time and with increased cost to the patient with larger out-of-pocket amounts, deductibles, copays, and coinsurance.
And as we heard from Dr. Atkins this morning, these drug-free intervals where we are getting a better response for these patients and these patients are living longer. That certainly does drive up oncology costs if they remain on therapy. If they go off therapy, obviously, there is some opportunity there for savings over time.
Slide 54
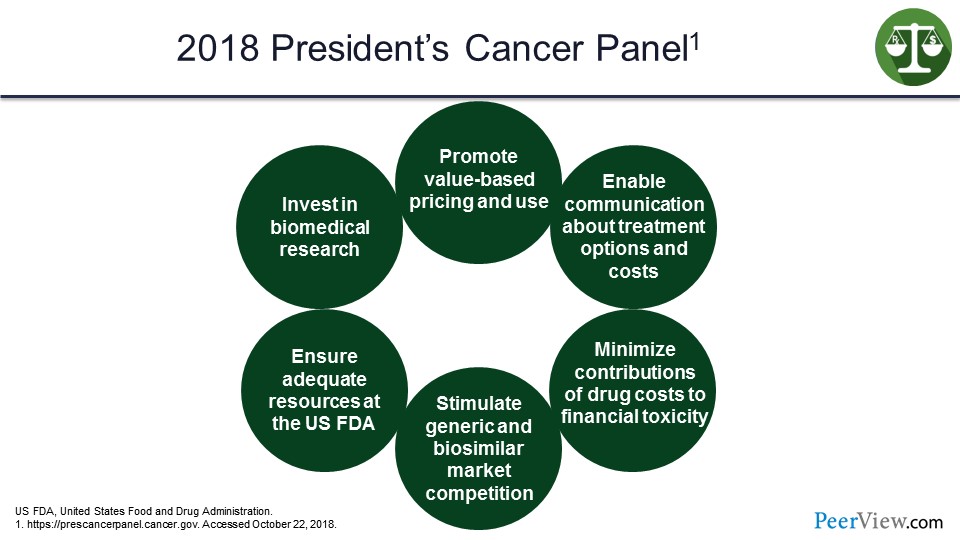
This concept of value comes up in a lot of different places. On the slide (Slide 54) we have the President's Cancer Panel 2018, and at the very top is “promote value-based pricing and use.” It looks at things like communication, minimize contributions of drug costs to the financial toxicity of patients in the system, stimulate generic and biosimilar market competition, ensure adequate resources at the US FDA, and invest in biomedical research. So again, the concept here is that value is at the top, and it is driving this process of managing and integrating these therapies into the treatment process.
Slide 55
It is no different in Europe. The European Expert Group on Immuno-Oncology was established to promote rapid access to new oncology drugs, allow for appropriate use, and develop a framework to stimulate scientific research and excellence in that regard.
Slide 56
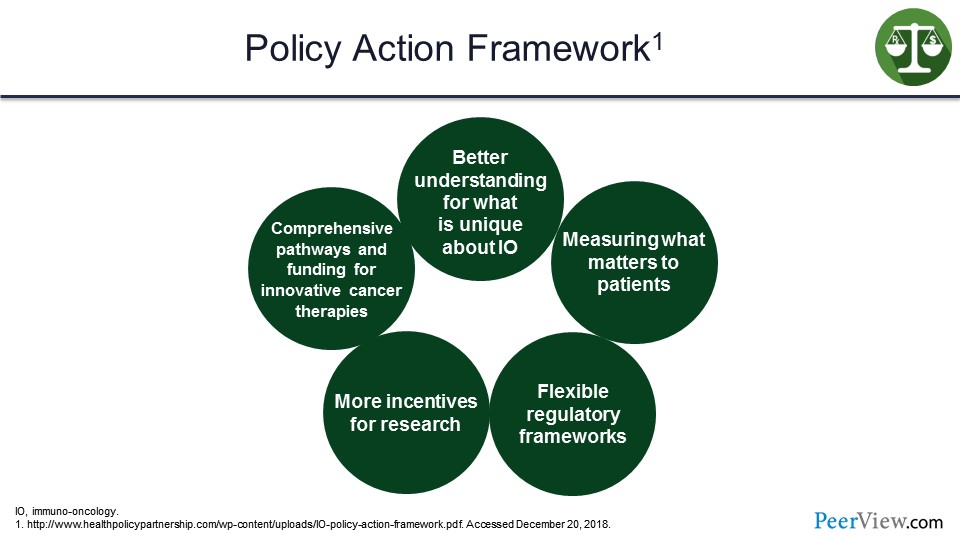
Their framework is a better understanding of what is unique about IO, measuring what matters to patients, flexible regulatory frameworks, more incentives for research, and comprehensive pathways and funding for innovative cancer therapies. So whether it is the United States or Europe, this concept of value is making its way in at the very highest levels of government regulation and services to try to figure out how do we determine the value. How do we determine where we are getting the best outcomes, and what is working effectively for our patient population?
Slide 57
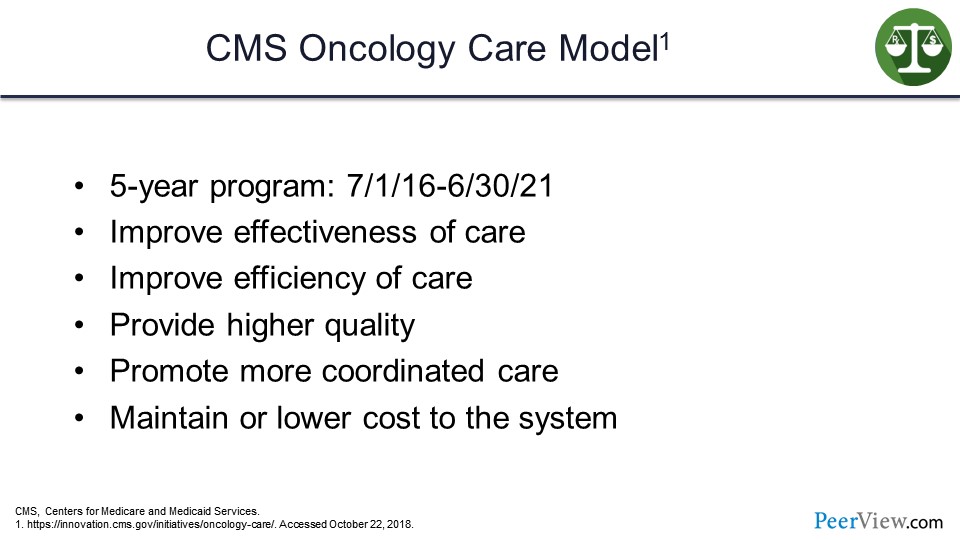
So the Centers for Medicare and Medicaid Services (CMS) established the Oncology Care Model (OCM), which is a 5-year program that started in July 2016 and will run through June 2021. And the design really was to improve effectiveness of care, improve the efficiency of care, provide higher quality, promote more coordinated care, and ideally, have it at the same or a lower cost to the overall system.
Slide 58
So physicians, basically, enter into payment arrangements with CMS. The physicians have financial and performance accountability, and it is primarily focused on episodes of care, in addition to chemotherapy administration. And the practices are providing enhanced services to these Medicare beneficiaries.
Historically, we may have seen the situation where the oncology team manages the patients, but, in some cases, they may be referred back to their primary care practitioners, and so there is sort of less coordinated care at the oncology space. This is designed to really drive that and include national treatment guidelines for care as part of that overall approach to managing the total cost and the total care of that patient as they have their journey through the treatment for a particular cancer.
Slide 59
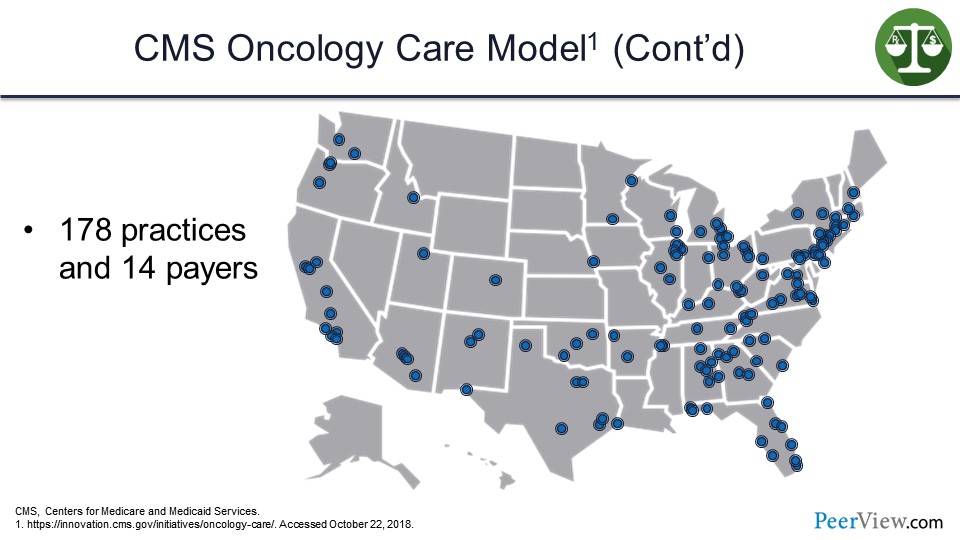
This slide just gives you an idea of the extent to which practices and payers are participating in the OCM across the United States. One hundred and seventy-eight individual practices and 14 payers are actually participating in the OCM.
Slide 60
Payment works as follows: There is a per-beneficiary monthly enhanced oncology services payment for the duration of the episode, and that is $160 on a per-member, per-beneficiary, and per-month basis. There are additional performance-based payments for episodes of chemotherapy care.
And then there is a retrospective annual calculation if they achieve certain OCM quality measures. And if they reduce medical expenses below target, there are additional resources or payments that can be made to the providers or to the health plans, if they achieve that savings.
Slide 61
So what do we expect here? The CMS Innovation Center expects the following if the OCM is successful: first and foremost, better care for the patient; smarter spending of our resources; healthier people; and, ultimately, shared decision-making with beneficiaries.
And we see that a lot more today, certainly not only in oncology but in other aspects of healthcare and other disease states. It is really getting that patient involved, engaging the patient in the conversation, explaining options and treatment availability, and not simply just putting the patient in a single pathway or a single approach, but really getting that patient involved and engaged, because that will improve the likelihood of a more favorable response.
Slide 62
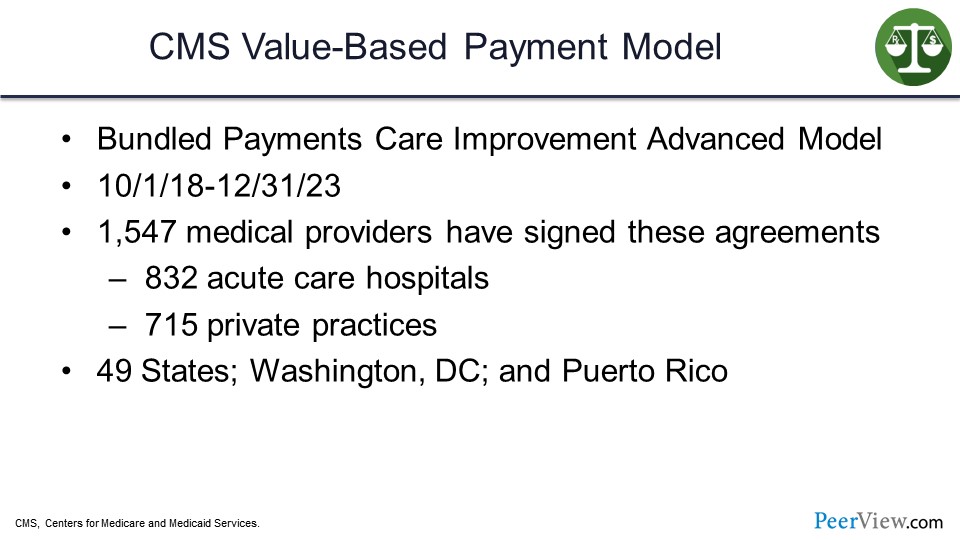
Another program is the CMS Value-Based Payment Model. In this slide we have the Bundled Payments Care for Improvement Advanced Mode l, and that is another program that started just recently on October 1, 2018. It is another 5-year program. There are over 1,500 providers who have signed onto these agreements, and they are either at 832 acute care hospitals or in 715 private practices.
This program is essentially across 49 states in the United States, as well as in Washington, DC and Puerto Rico.
Slide 63
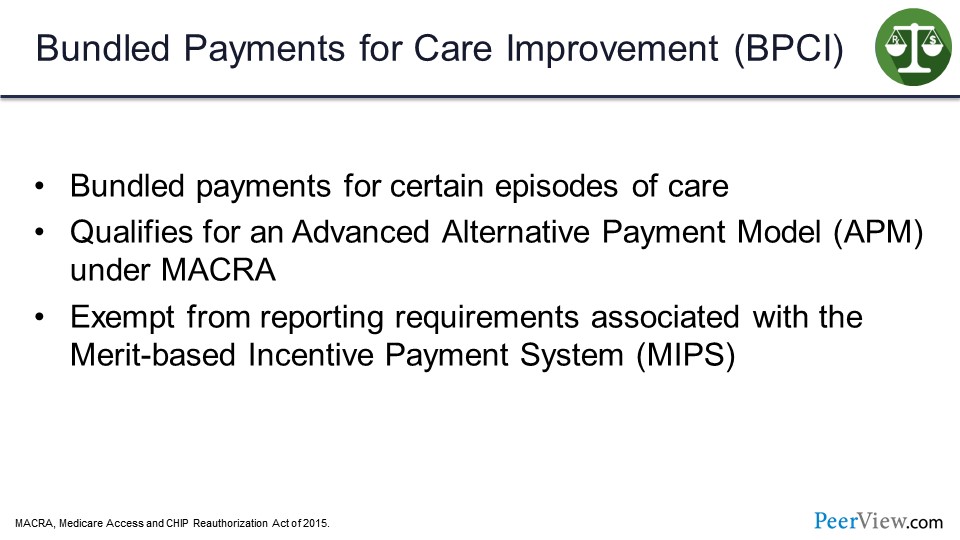
These bundled payments for care improvement are really identifying certain episodes of care, and they qualify for the advanced alternative payment model under the Medicare Access and CHIP Reauthorization Act of 2015 if they participate in these programs. And they are exempt from reporting requirements associated with a merit-based incentive payment system.
So again, another incentive program and another value-based design for providers to participate in, that is hopefully going to drive more comprehensive and coordinated care, deliver additional savings to the system, and also improved outcomes for the patients.
Slide 64
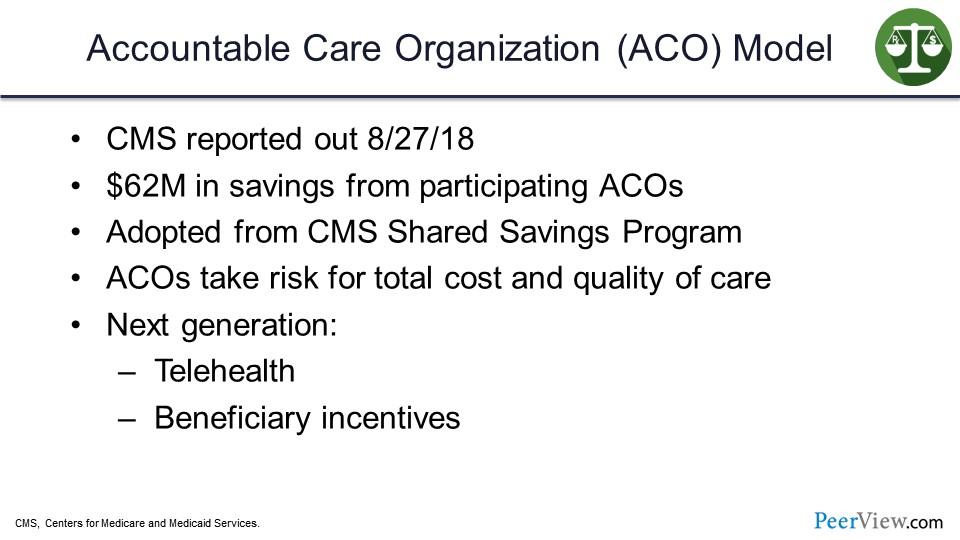
The Accountable Care Organization (ACO) model is one with which we are certainly very familiar. It has been in play for quite a while now. CMS did report out on August 2018, and it was demonstrated that over $62 million in savings was achieved from the participating ACOs. Again, we are looking at a situation where these ACOs are taking risks for a population; they are taking a risk for both medical and pharmacy spending in these patients.
They did adopt this from the CMS Shared Savings Program, and this total risk concept has again panned out very well in the early experimentation phase. And the next generation of the ACO is going to look at things like incorporating more telehealth services and programs, as well as developing additional incentives for beneficiaries to be willing to participate in this model.
So if you are familiar with the concept, the patient has the option in a lot of cases when they are interacting with a practice, whether they want to participate with the practice on the ACO side of the equation or not. So, again, in developing some incentives for beneficiaries to appreciate and understand that concept and not feel as though they are going to be put in a program that is going to restrict or limit their access to services but, in fact, could deliver better, more coordinated care for those patients is an opportunity here with the sort of next generation of the ACO programs.
Slide 65
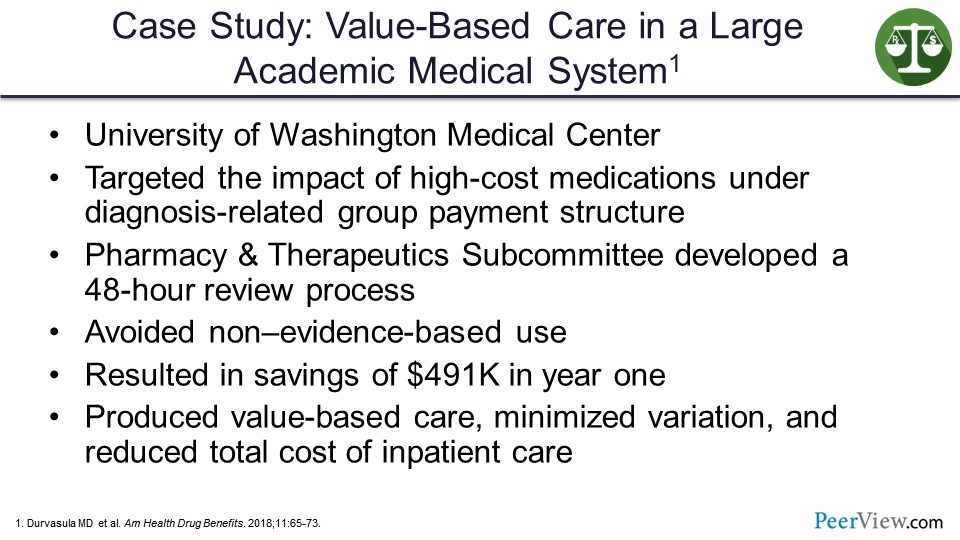
So this slide presents a case study of value-based care in a large academic medical system, specifically the University of Washington Medical Center. They looked at their standard diagnosis-related group payment system and medication costs to try to figure out ways to drive additional savings to the program as they incorporated new oncology and new high-cost therapies into the practice.
They created a subcommittee of their Pharmacy and Therapeutics Committee designed to rapidly review new products or requests for use of products that would be outside the label or outside of the hospital standard practice. They were trying to avoid non–evidence-based use but still give a rational approach to those cases where it did make sense, as these requests came in. They were able to generate a savings of over $500,000 in the first year. They essentially felt that they produced a value-based care model minimizing variation and reducing total cost of inpatient care through an efficient use of the pharmacy and therapeutic system and by reviewing and analyzing the products much more quickly and effectively.
Slide 66
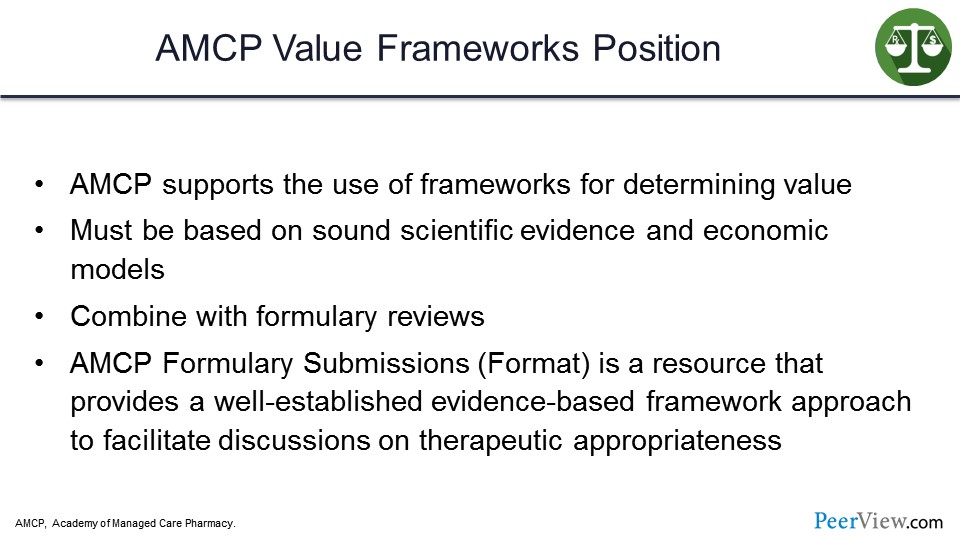
The Academy of Managed Care Pharmacy (AMCP) has a value frameworks position. They do support the use of value frameworks for determining value. They feel it must be based on sound scientific evidence and economic models and be combined with formulary review.
Without question, it all starts with the science. We have to have good scientific evidence, good products to really consider this concept of value. And the AMCP Formulary Submissions, or the format for formulary submissions, is a resource that provides a well-established, evidence-based framework approach to facilitate discussions on therapeutic appropriateness. We have this concept of value appearing in a lot of different areas, whether it is CMS or whether it is AMCP. But everyone is really pushing this concept to try to see if we can make some improvements in the delivery of care and improve on the outcomes side.
Slide 67
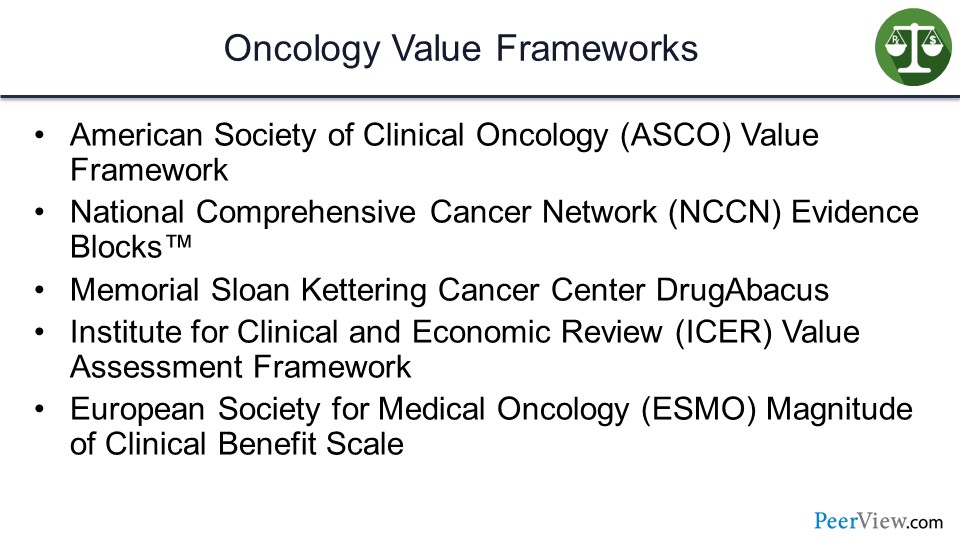
In oncology, we have a number of value frameworks that are available. The American Society of Clinical Oncology (ASCO) Value Framework, we have the National Comprehensive Cancer Network (NCCN) Evidence Blocks™, the Memorial Sloan Kettering Cancer Center (MSKCC) DrugAbacus, the Institute for Clinical and Economic Review (ICER) value assessment framework, and the European Society for Medical Oncology (ESMO) Magnitude of Clinical Benefit Scale.
Slide 68
We have all these different value frameworks, so how do we sort through them? And how do we figure out which ones, perhaps, would benefit the practice? And which ones might benefit the health plans in terms of managing these products? These are things the Pharmacy and Therapeutics Committee can review; the clinical team also can review to try to assess differences among products and to try to determine which products or services are going to deliver improvements on value.
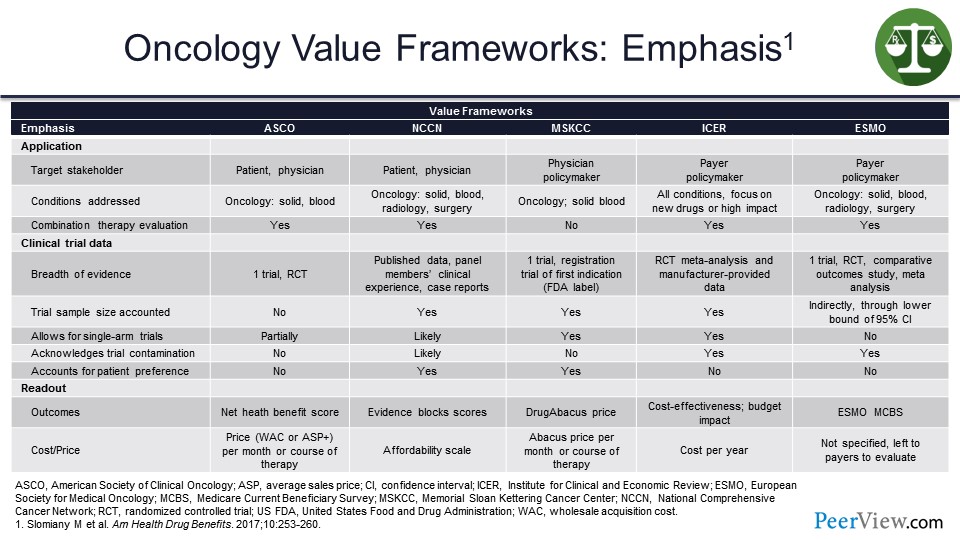
This slide illustrates the emphasis of the oncology value frameworks. At the top we have the target stakeholder, so they are the patient and physician. We can see on the slide, in each case, they are slightly different. I am not going to highlight every single box here but just want to show that depending on the individual value framework, it may look at the patient and the physician. There may be a policymaker piece to some of these, so these certainly would likely be more appropriate and more interesting and more valuable to the managed care side of the equation.
Obviously, others may be much more focused, so we can think about the NCCN Evidence Blocks™; they are a very good visual opportunity for the physician to sit down with the patient and show them the benefits and the risks of toxicities with some of these therapies. So that model is more patient-friendly.
The ICER value assessment framework is certainly more familiar to those of us on the managed care side, from the policymaking side certainly. In terms of conditions addressed, across the board they are oncology for all except the ICER value assessment framework that does a lot more products outside of the oncology space.
And if we look at the cost piece at the bottom here, some of them do incorporate cost and some incorporate affordability. The point to be made here is that there are a lot of different options, but they are not all the same. So you could argue that from a plan perspective, you might try to zero in on one that you felt was most comfortable and perhaps fit your programs and services more effectively.
But the answer is not a simple one. And originally when the ASCO Value Framework was put together, it did not incorporate cost initially, but they have since adjusted that. And so, that is a helpful piece for us, because we believe we need cost in the equation if we are going to really, truly assess total value here.
Slide 69
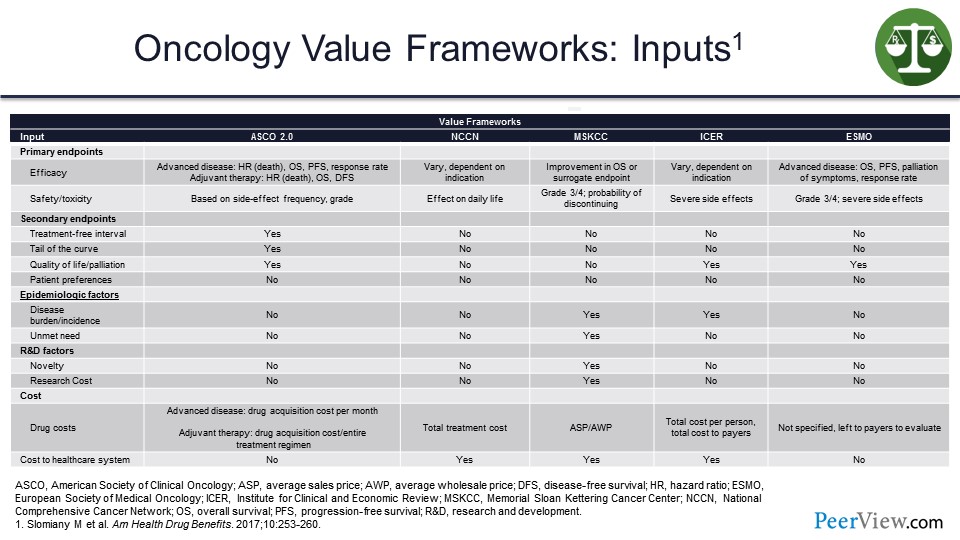
Moving on to the inputs, certainly, from an efficacy perspective, in this slide we can see with ASCO 2.0, it is advanced disease. For NCCN, it varies, but it is indication-driven primarily. For ICER, it is dependent on the indication and so forth. So slightly different inputs on the efficacy side for each value framework, and safety is pretty much comparable.
And, ideally, coming back down here to the health cost area: advanced disease state, drug acquisition cost per month for ASCO; total treatment cost for NCCN; average sales price (ASP) for the DrugAbacus; total cost per person or the unit cost on a PMPM basis for ICER; and then, ESMO is using no specific item here in terms of cost to payers. Variety again—a lot of differences here in terms of the inputs for each value framework represented in the slide.
Slide 70
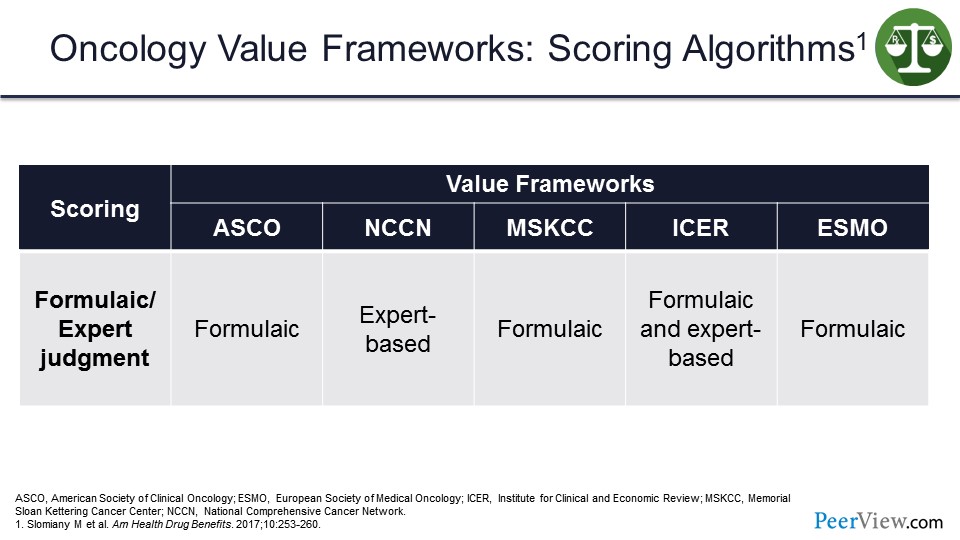
If we look at the scoring algorithms, they are a little bit more straightforward compared with the emphasis and inputs. ASCO, MSKCC, and ESMO are all formulaic, whereas NCCN and ICER are expert-based algorithms. But ICER also has a formulaic algorithm that they used to try to drive the calculations for the value frameworks. So again, these slides are just to share some of these differences between the oncology value frameworks.
Slide 71
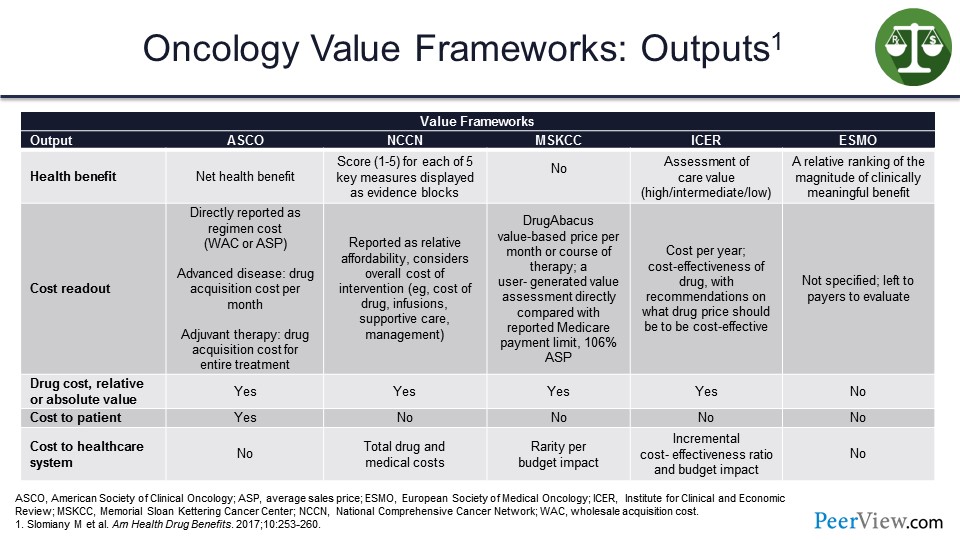
And then, the outputs for each value framework. So what are we getting? What do we see as the output that the health plan can use and/or the providers can use, if they are trying to assess what is an appropriate value framework? How do I calculate the benefits here?
So the health benefit for ASCO is a net health benefit. For NCCN, they score these 1 to 5 in their Evidence Blocks™. MSKCC does not have a health benefit calculation; ICER has an assessment of care value in their model. And for ESMO, it is a relative ranking of the magnitude of the clinically meaningful benefit. So in each case on the slide, with the exception of MSKCC, we are trying to calculate some type of health benefits scoring to determine how effectively the patient is responding to therapy.
As far as drug costs, it is relative or absolute value across the board, except for ESMO. Cost to patient is only factored into the ASCO framework, and the cost of the health system is the one that ICER really focuses primarily on here. We can also look at the incremental cost-effectiveness ratio and the budget impact. And, again, the ICER framework is the one that we are most familiar with, as it relates to trying to determine how cost-effective a particular product might be.
Slide 72
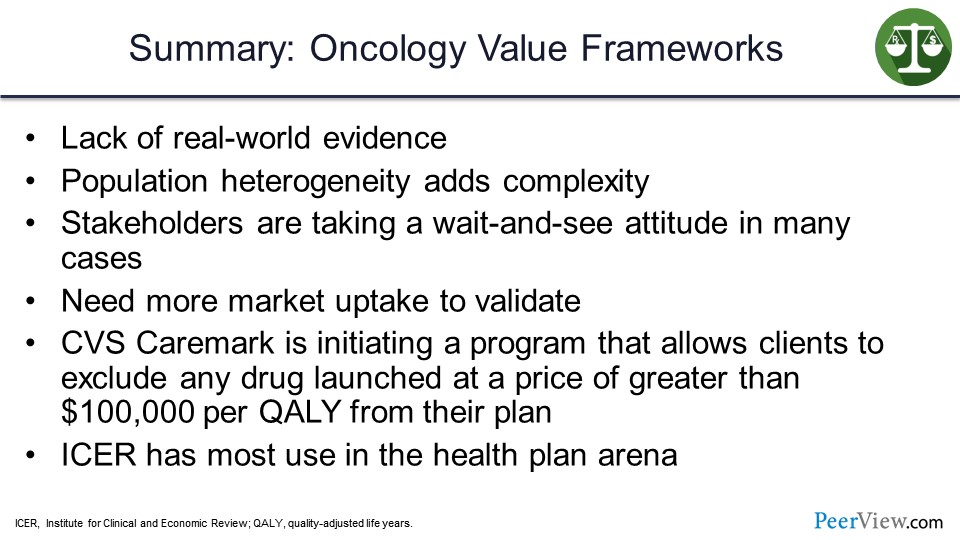
In summary for the oncology value frameworks, some of the challenges are a lack of real-world evidence and in the population, heterogeneity does add complexity. And, again, we saw the significant differences without going painfully through all the lines on the slides.
A lot of stakeholders are taking a wait-and-see attitude to try to figure out how they can incorporate these value frameworks into the practice. We definitely need more market uptake to validate them, and that real-world evidence will certainly help.
But there are interesting things occurring in the market. CVS Caremark is initiating a program that allows its clients to exclude any drug that has launched at a price greater than $100,000 per QALY from the plan. And ICER has the most use in the health plan arena, because ICER does use the quality calculation as their primary measure of value.
Slide 73
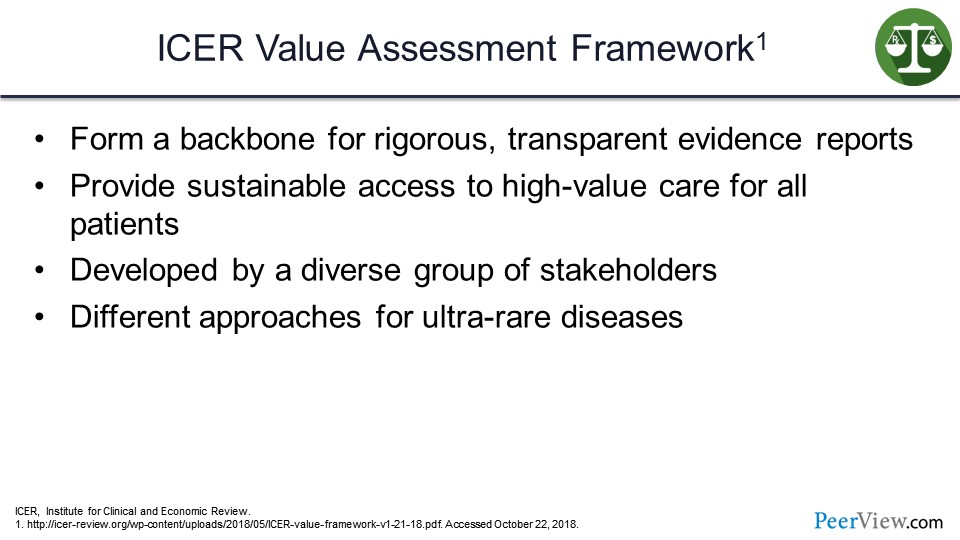
The ICER value assessment framework forms a background for rigorous, transparent evidence reports. It provides sustainable access to high-value care for patients. And it was developed by a diverse group of stakeholders applying different approaches for ultra-rare diseases. As you would suspect, that quality threshold is going to be higher for a rare disease than it would be for a more common disease.
Slide 74
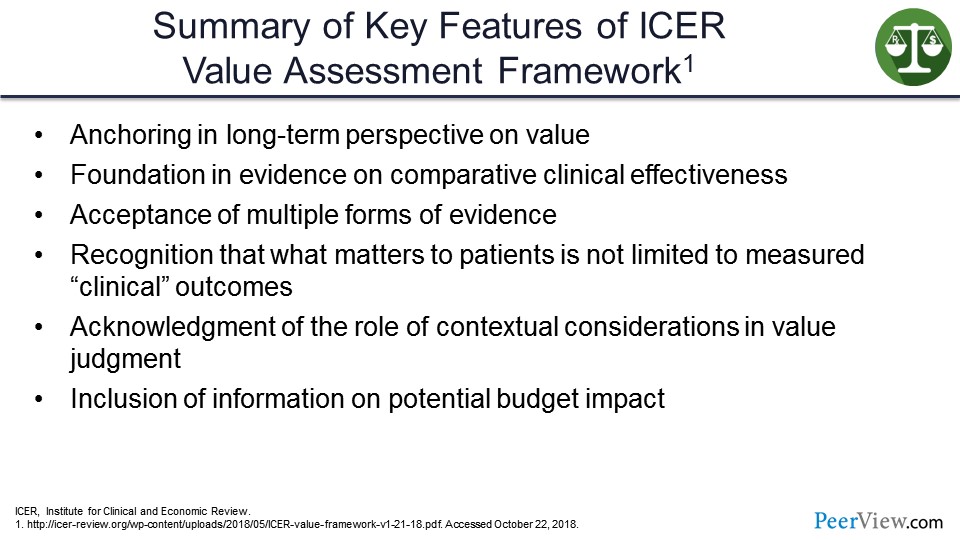
The key features of the ICER value assessment framework are: It really is anchored in a long-term perspective on value, so that QALY measure over the long term. And its foundation is in evidence and looking at true comparative clinical effectiveness, when available.
Moreover, this framework looks at multiple forms of evidence as it gets integrated into the decision-making process, and applies a recognition that what matters to patients is not necessarily limited to the clinical outcome. Therefore, there is that patient element that needs to be included. ICER also acknowledges the role of contextual considerations in the value judgment, and that the inclusion of information on the potential budget impact is central to that assessment.
Slide 75
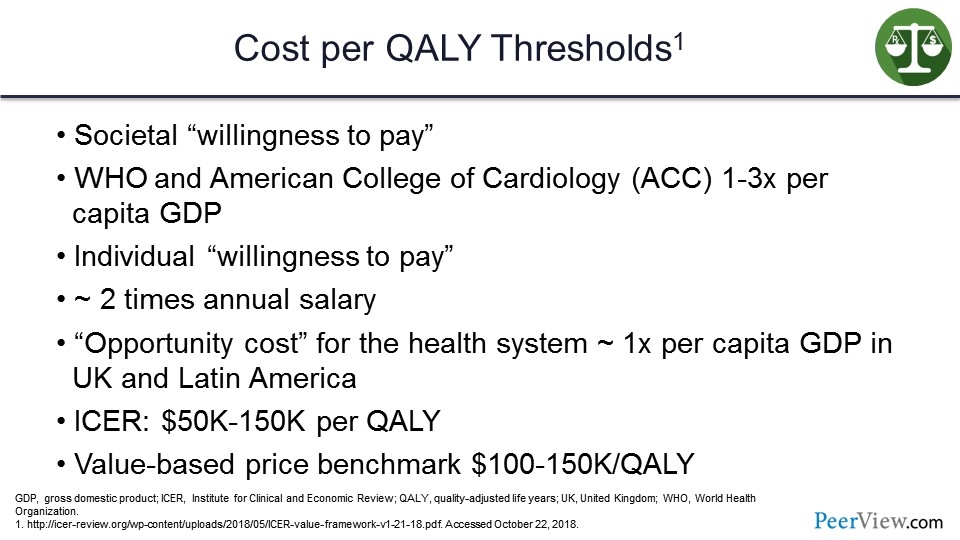
This slide looks at some of the cost per QALY threshold options that you may see. As I mentioned, ICER has theirs at about $50,000 to $150,000 per QALY. But you can use a societal “willingness to pay” measure. The World Health Organization and the American College of Cardiology looked at one to three times the per capita GDP as a measure of a QALY threshold.
Individual willingness to pay is about two times the annual salary for a person. The opportunity costs for the health system are one times per capita GDP in the United Kingdom or Latin America are often used to define what is an appropriate QALY. And a value-based price benchmark is $100,000 to $150,000 per QALY. So again, not only do we have a number of different value frameworks, we also have different measures for what we are going to use as our threshold for a QALY. If we are going to use a relatively low number of $50,000, then it gets very interesting because if you look at what is the cost of a surgery today in the United States, it is less than $50,000. So if we have a drug treatment that is a single treatment that costs more than $50,000, surgery might be a less expensive option than that particular agent.
Slide 76
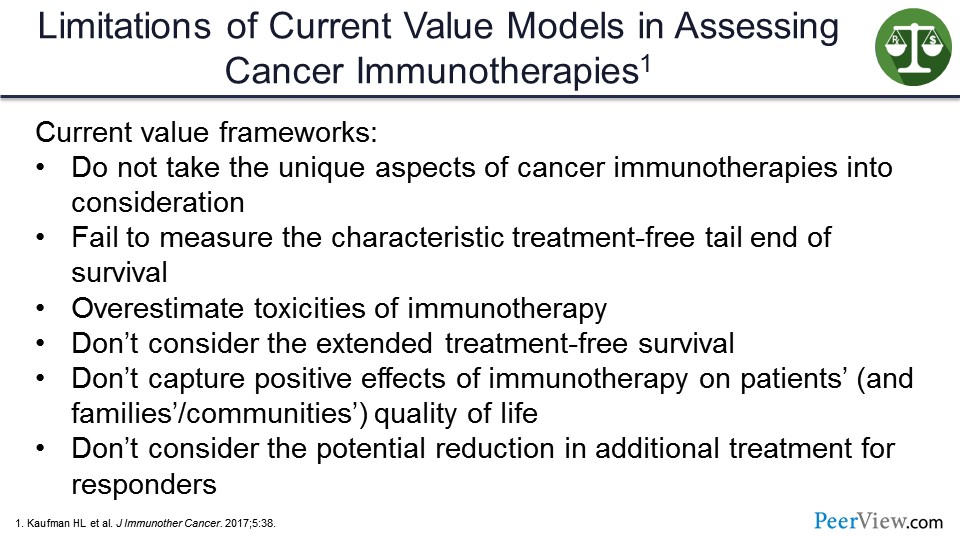
What are the limitations of the current value models in assessing cancer chemotherapies? These are data from Kaufman and colleagues who reported that current value frameworks do not take the unique aspects of cancer immunotherapies into consideration. The current value frameworks fail to measure the characteristic treatment-free tail end of OS, which Dr. Atkins talked about in his presentation where we saw that significant treatment-free interval that was quite impressive.
The current value frameworks also overestimate toxicities of immunotherapy. Again, we heard earlier today that most of those toxicities are maybe a month or so in terms of the toxicity window and then the improvements occur. They do not capture the positive effects of immunotherapy on patients' quality of life, and they do not consider the potential reduction in additional treatment for responders. Again, part of the process of this experimentation is in improving on the value models and incorporating them into practice.
Slide 77
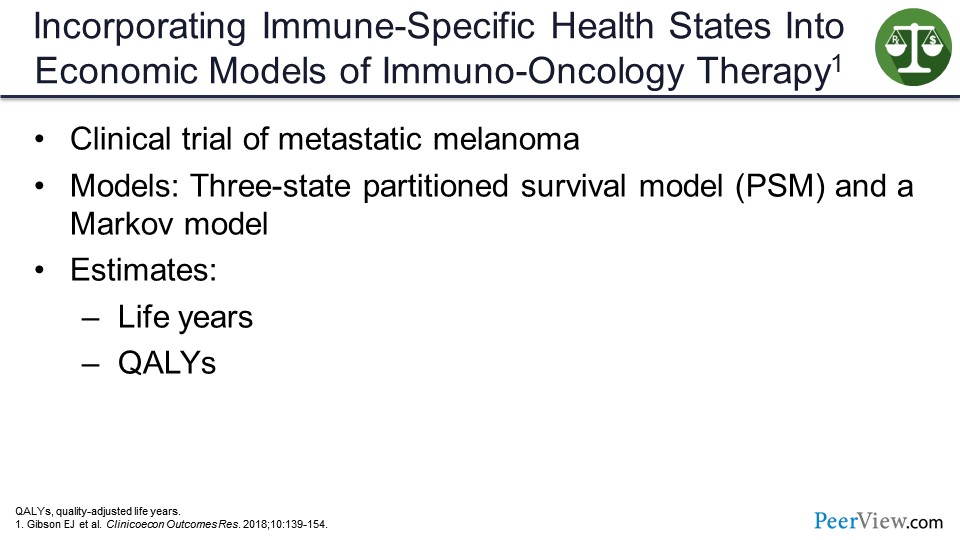
Incorporating immune-specific health states into economic models of IO therapy—this is work from Gibson and colleagues. They looked at a clinical trial of metastatic melanoma, and they had two models they focused on, the partitioned survival model (PSM) and a Markov model. And the estimates included life years and QALYs.
Slide 78
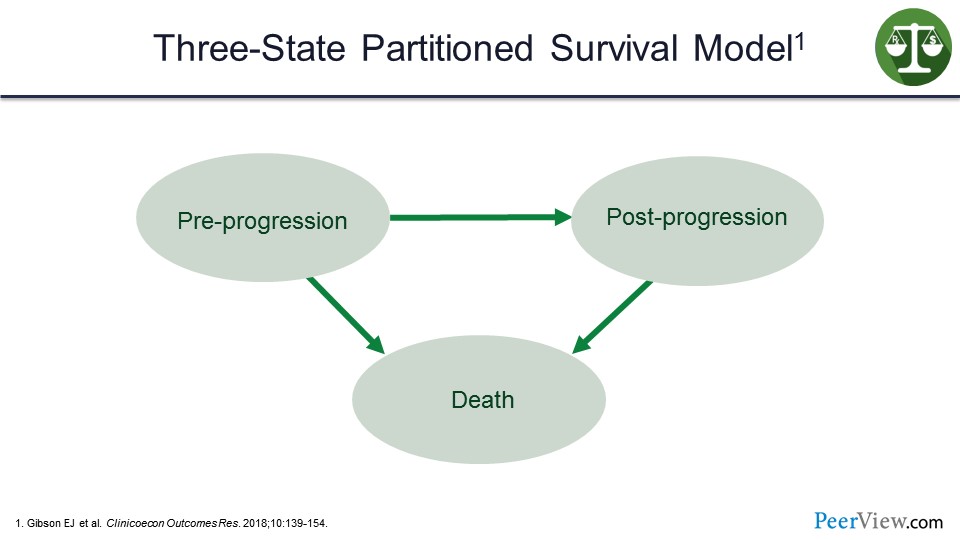
The three-state partitioned survival model looks at pre-progression, post-progression, and death as the three states in the model.
Slide 79
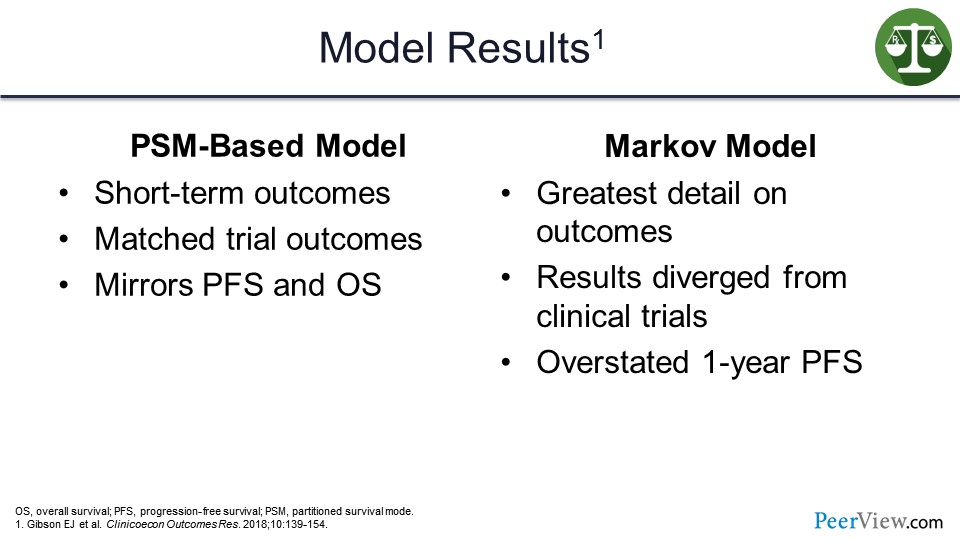
What they found when they ran the models is that the PSM-based model definitely performed well and measured the short-term outcomes well. It did match the trial outcomes and mirrored PFS and OS.
The Markov modeling, on the other hand, provided the greatest detail on outcomes, but the results did diverge from the clinical trials. This model did overstate the 1-year PFS model.
Slide 80
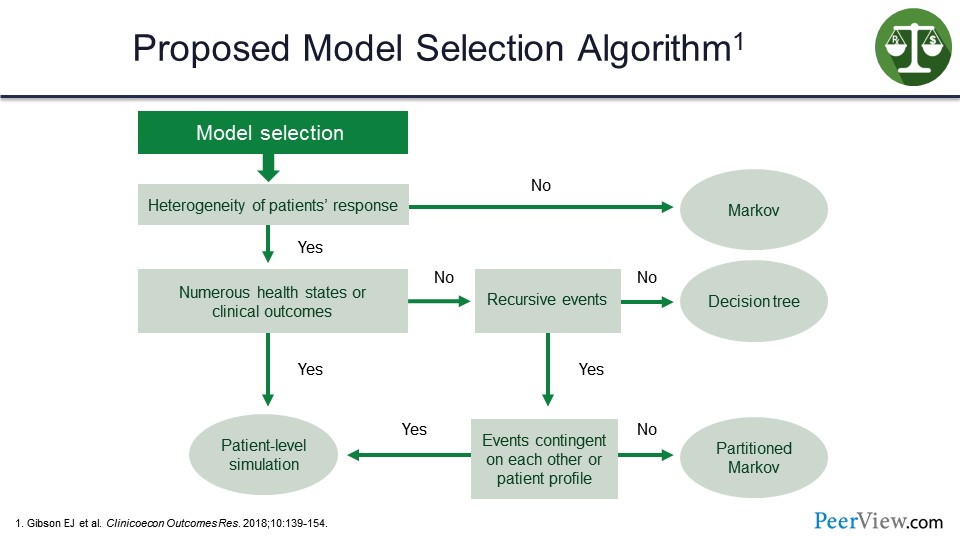
So what Gibson and colleagues suggested was that the various differences in terms of what approach you might take and what model you might apply are dependent on the particular case.
Clearly, the heterogeneity of patient response here is the first question. If there is not any real heterogeneity, the Markov model is going to be the ideal model to provide a more accurate assessment. If there is heterogeneity, then we come down to see whether or not we have numerous health states or clinical outcomes. If not, do we have recursive events? If not, then the decision-tree model is going to be the most accurate and most sensitive.
If we do have numerous health states, then the patient-level simulation makes sense. But, as the slide shows, it does get a bit complicated. If the events are contingent on each other or a patient profile: if no, the petitioned Markov; if yes, back to the patient-level simulation.
The point is that we can use modeling to assess what the value of these therapies may be, but it may be a bit complicated in terms of choosing the right model, not to necessarily cook the books, so to speak, but really to get a more accurate assessment of what the results may be without having that real-world evidence to be able to use the modeling to drive those experiments.
Slide 81
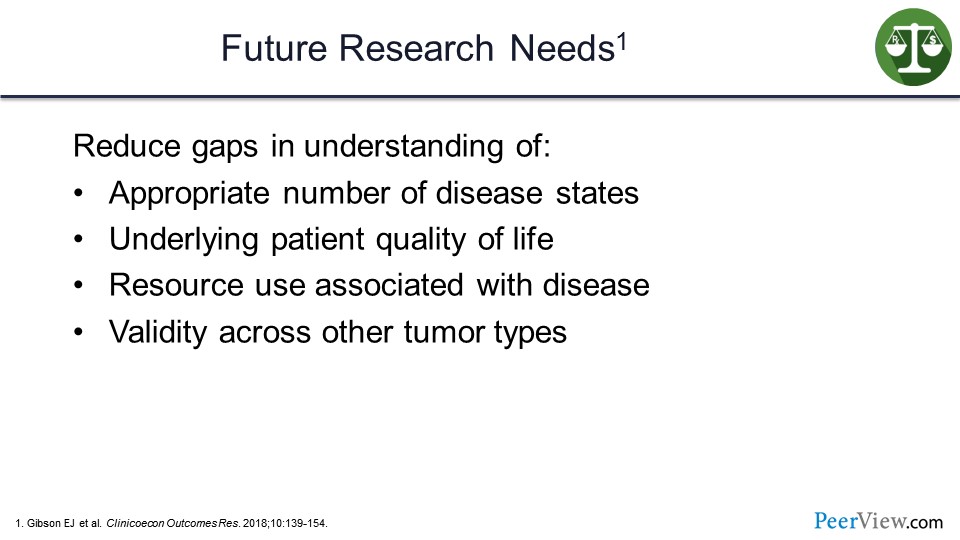
What are our future research needs? We need to understand the appropriate number of disease states to put this into the modeling. Moreover, reducing gaps in understanding the underlying patient quality of life and resource use associated with specific diseases and cancers, as well as developing validity across tumor types are all very important in for further developing this modeling approach.
Slide 82
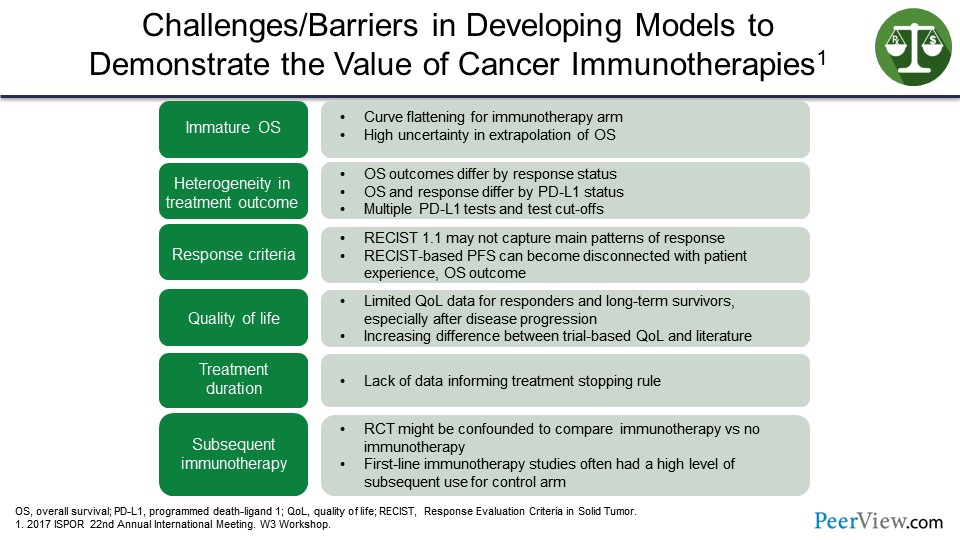
What are the challenges and barriers in developing models to demonstrate the value of cancer immunotherapies? This is from a poster presented at the 22nd Annual Meeting of Internation Society for Pharmacoeconomics and Outcomes Research. And there is a lot of information on this slide, but suffice it to say that what we are looking at is if we have immature OS data, heterogeneity in the treatment outcome, the response criteria certainly can make a difference here.
We have found that the Response Evaluation Criteria in Solid Tumors (RECIST) version 1.1 may not capture the main patterns of response, and RECIST-based PFS is disconnected from patient experience. There are limited quality of life data here for responders and long-term survivors. There are a lack of data on treatment duration as well. And lastly, the subsequent IO treatment, the randomized controlled trials may be confounded to compare IO with no IO. The first-line IO studies often had a high level of subsequent use of immunotherapy for the control arm. So again, suggesting that there are some challenges and may be some barriers to developing these models due to the variability and the various cancer immunotherapies.
Slide 83
This is the definition of value-based contracts from the AMCP forum held in 2017. It states that a value-based contract is a written contractual agreement in which the payment terms for medications or other healthcare technologies are tied to agreed-upon clinical circumstances, patient outcomes, or measures.
Slide 84
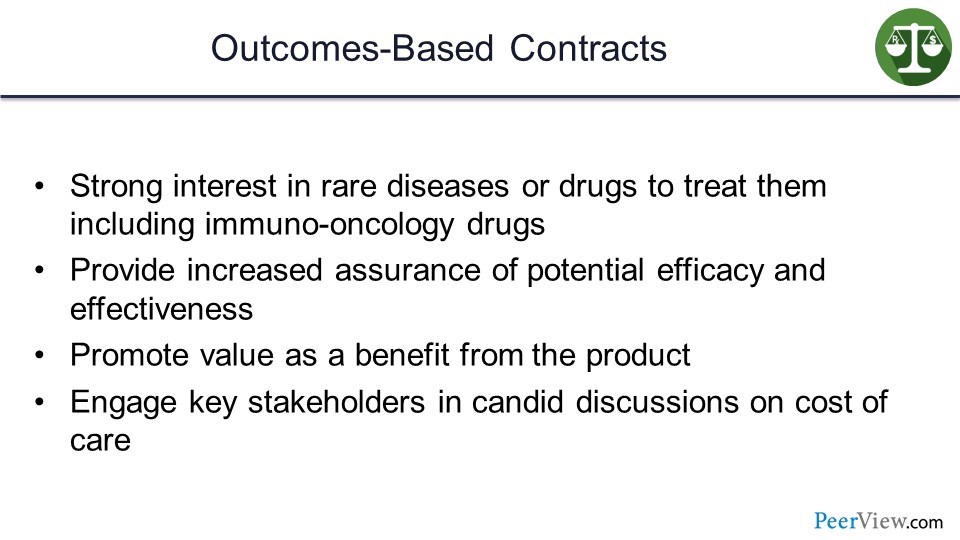
There is an opportunity for outcomes-based contracts, certainly in the oncology space, and there is an opportunity in IO. There is a strong interest in rare diseases, and the drugs to treat them, as discussed earlier, based on the high cost and the impact on budgets for the various plans and insurers.
Outcomes-based contracts provide increased assurance of potential efficacy and effectiveness, and they promote value as a benefit from the product. I mean, ultimately that an outcomes contract is helping us define and identify those products that deliver the greatest value, and they do engage key stakeholders in candid discussions on the cost of care.
Slide 85
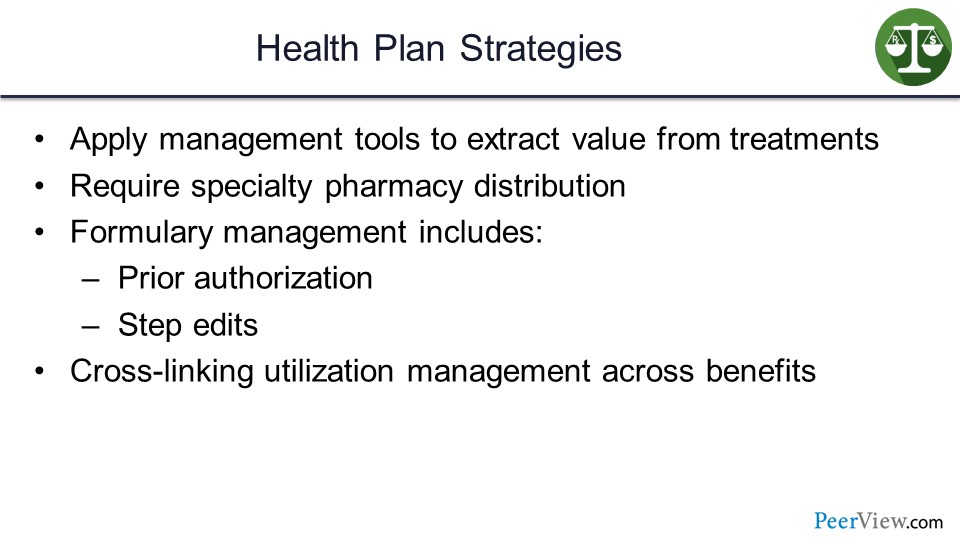
The strategy from the health plan perspective is really to apply management tools to extract that value from the treatments and require using specialty pharmacy distribution where appropriate. Formulary management techniques are pretty standard. Those of us in the business are very familiar certainly with prior authorizations and step edits.
But, ideally, what we are trying to do there is to drive that appropriate use, to engage the conversation, and hopefully not put barriers in place of a good practice pattern at the physician level, and then cross-link these utilization management programs with the benefits.
Slide 86
Successful value-based partnerships are going to move away from transactional-based interactions and really promote that collaboration in disease management. Therefore, not putting barriers in place, but really allowing that process to occur.
Cross-functional teams at the plan and the manufacturer can work together to develop these types of contracts and identify real-world opportunities for exploring these models. And as we gain more experience and exposure with real-world evidence, that experience and evidence can inform and help to drive formulary decisions and benefit decisions in the future.
Audience/Faculty Q&A
Slide 87
Dr. Kenney: So with that, we have reached the end of the formal presentation and now we are willing to take questions, if you will. We have a few questions that have come in.
So the first question for Dr. Atkins: “Would there be any side effects in the future, such as immuno-resistant cancer, misdirected autoimmune response, et cetera?”
Dr. Atkins: So clearly, the toxicities of immune therapy are primarily immune-related toxicities where the immune system recognizes the host and causes inflammation in a normal structure. Skin is most common, colon or colitis, lungs, thyroid gland. You name it; there has been evidence of inflammation from the immune system attacking the normal tissue.
The hope is when we are giving immune therapy, and what we are relying on is that the tumor will look more foreign to the immune system than the host. And that differential in immunogenicity is what we are trying to use in order to eliminate the tumor before the immune system starts attacking the host.
When we are giving immune therapy, when I see toxicity in the model where the immune system is more able to recognize the tumor than the host, it is because we have driven the activation of the immune system up too high. Maybe we are, let us say, ten-fold when all we need is eight-fold to attack the tumor.
And so, we have tried to encourage physicians when they are experiencing toxicity to think of it in those terms and not have a low threshold for stopping the therapy or holding the therapy and giving immunosuppressive drugs to titer down that immune activation, so that now it is just recognizing the tumor and not the host.
Now, there are some patients where their tumor is not very different than their normal tissue or where the immune system is recognizing a shared antigen that is shared by normal tissue. And in those cases, it is very difficult to actually treat them with immune therapy, and they probably need a better treatment.
But the key is that the goal of the therapy is to activate the immune system, and so I do not consider it toxicity when someone has their immune system over activated. I consider the treatment working, or at least having a chance to work, and then it is just titrating it to the right level to allow it to finish the job if possible.
Most of those toxicities, if you suppress, if you titer down the immune response, will resolve within 4 weeks. Most of those patients can be treated largely as an outpatient on steroids while their toxicities are resolving. Most of those patients do not necessarily need more therapy, or if they do need more therapy, it could be a portion of the therapy they were getting for a shorter period of time. And I do not think it is appropriate to look at the toxicity curves and factor that in in a major way in determining the efficacy of a particular therapy. I think the biggest toxicity we are still facing is death from cancer, and you should be looking at those tails of the OS curves.
Slide 88
Dr. Kenney: Thank you, Dr. Atkins. Next question is for me: “Which value framework, if any, do you use at Harvard Pilgrim? Are the value frameworks consistent in evaluating therapies?”
So the one that is most relevant to us, as I suggested in the presentation, is the ICER value framework. We see a lot of ICER reports. We do read those, evaluate those. Our clinical team will go through those.
I think one of the challenges we have is often the analysis comes out after the drug is approved. We have to make decisions sometimes very quickly in terms of where it is going to fit in the benefit, and what the coverage criteria might be. And in fact, if the ICER assessment is that a drug is overpriced based on their value assessment, we can certainly request a lower price from the manufacturer. But typically, that does not work right away.
I did have some fun when the PCSK9 report came out that suggested that they were overpriced significantly. I did call my account person and request a sizable discount, which did not play out, as you might suspect. But I think where we are finding ICER being more helpful is in some cases the manufacturers are actually modeling with ICER upfront.
I think we saw that most recently with the migraine therapies, with the calcitonin gene-related peptide inhibitors, where the initial launch price of the drugs, the first ones to come to market were informed to some extent by the ICER evaluation that was done prelaunch. So the manufacturers that can take that approach, we find that to be much more valuable.
They still may be a fairly expensive therapy. They still may add to the total cost of care, but the launch price is more reasonable. So we think that is a very helpful dialogue that is occurring, and we are engaging more in that concept upfront. But it certainly does inform the process and encourage us to apply utilization management criteria, as appropriate, depending on the value assessment of the product.
Slide 89
Dr. Atkins: Lot of questions here, Jim.
Dr. Kenney: Yeah. Oh, good. All right, what do we have next? “Dr. Atkins stressed that the value of immune-based therapies may extend out over the long-term. However, value-based contracts often focus on outcomes measured over only 1 to 2 years. How can value-based contracts be modified to account for long-term benefit?”
Well, I think as we negotiate these contracts and we look at these, there is no question that there is a longer-term that you have to focus on. I think what we would typically see in a value-based contract would be trying to reduce those significant or robust medical events that might occur over a 1- to 2-year period.
Now certainly, with drugs that have a fair degree of toxicity, we could look at the risk of hospitalization, the risk of, you know, having to visit the emergency room, having other procedures, or other drugs that might be used. I think certainly that is very important to consider.
But for that long-term benefit, it likely would not apply very favorably for a value-based contract unless you were going to pay a significant amount of money for the product upfront and take regular routine measures, if you will, of the value or effectiveness of that product over time. Do you have one you like over there, Dr. Atkins?
Slide 90
Dr. Atkins: “In your experience, what has been the appetite for outcome contracts among oncology products and manufacturers? Do you anticipate this changing in the future?”
And I would like to see some way in which we can actually tie the cost of therapy to their actual outcome, where we could make these checkpoint inhibitors available to more patients by bringing the cost down for the initial few doses and then having some sort of measure about whether they are actually being effective and have to pass some threshold in order to continue, and then actually have the price change as the clear value of those products changed.
And I would also like to see that you have to have a defense for why you are going to continue therapy after 6 months or a year, instead of it be the default that you treat patients until they progress or until they have a toxicity. That you have to prove that there is still cancer there in patients after a year before you can actually continue the treatment.
So a lot of people look at the cost of doing a biopsy as being expensive, and analyzing that tissue as being expensive, but it is trivial compared with the cost of giving therapy that either is not working or is not necessary anymore.
Dr. Kenney: Yeah, and we see that in some therapies in the marketplace today, where companies will provide that. We see that in the CAR-T therapies where the Novartis product is basically provided, and the tisagenlecleucel product is provided and there is no payment for the first 30 days. And if the patient responds, then payment is made.
So what is interesting is it sort of works reasonably around issues of best price or costs associated with that, when it relates to reimbursement. There is no best price implication because the product was not paid for if ultimately, after 30 days, it is not working effectively. So it is kind of an interesting approach to that.
And we have other examples in other disease states where companies will provide the first couple of months of a drug at no cost, and then ultimately the patients who respond would get prescriptions and would continue. So that is certainly a benefit for the plans.
Slide 91

Dr. Kenney: Here is an interesting one, Dr. Atkins: “Next-generation sequencing panels are often large and could contain several nonactionable mutations. How to determine when an NGS panel should be used versus a smaller panel or a single mutation test?”
Dr. Atkins: Yeah, so that is a difficult question. I think usually, as I mentioned in my talk, in the future I see tissues going to places that can in a regimented way, go through all the potential biomarkers for immune therapy, which include tumor mutational burden, gene expression profiling, immunohistochemistry for immune cells, as well as for PD-L1. I think next-generation sequencing will just be a part of the analysis of a tumor.
But when you are looking at whether you are going to give someone a targeted therapy and you have a sick patient in front of you, such as a patient with melanoma who is in the hospital, there is no need to wait 3 weeks for the BRAF test to come back out of a panel of next-generation sequencing. In that case, if your institution or if you have access to a test that just tests for a BRAF mutation, that can be lifesaving for that patient.
Or even we find that using an immunohistochemistry test that can be done that day, even though it does not pick up all the relevant BRAF mutations, can help identify the patient who you can start a targeted agent on and is likely to benefit while you are regrouping and deciding what therapy you will give afterwards.
Slide 92

Dr. Kenney: Next question: “Do you think the adoption of a single threshold of ICER, like in the case of CVS Caremark, will become a trend? Can it be more of a range, $150 to $100,000 per QALY?”
And clearly, it needs to be a range. It certainly depends on the particular disease. As I mentioned earlier, if it is an orphan disease, that cost per QALY could be significantly higher to reflect that, depending on what is involved in the disease process.
What does that patient journey look like in terms of resource utilization over time? Because that also is going to be factored into that conversation. It is not just the cost of the drug, but clearly that is something that can be adjusted.
I think the challenge you have in the CVS Caremark model is you are going to have drugs that you build this formulary around that do have the ICER assessment on, but then you are going to have to evaluate drugs that may not have the ICER assessment and how do you factor that in and into the equation?
So I think it is a great concept in thinking about trying to build a formulary around those drugs that have the best QALY scores. But you are still going to need those products that are unique sole-source that are, you know, required to have on the formulary as part of that process.
Slide 93

Dr. Atkins: So how about the top question: “Are there treatment-effectiveness and/or value-based models that incorporate cancer prevention behavior and screening?”
And I am seeing a lot of companies that self-insure or groups of companies that self-insure, and I think that represents a growing part of the insurance market focusing on cancer prevention and lifestyle modification for their employees and giving them incentives for doing things like exercising or having a healthy diet, or for going in and getting their blood sugar, hemoglobin A1c checked, or keeping their blood pressure under control.
I anticipate that we will see more of that because having a healthy workforce really helps the businesses, not just by paying less health insurance but by having less absenteeism and getting more output from their workforce.
Slide 94

Dr. Kenney: Thank you. “Cost versus affordability is a concern. Chief financial officers and patients do not understand QALYs. How do you communicate effectiveness relating to affordability?”
So I think that is a very interesting challenge. I think from our perspective, you know, we are looking at total cost of care.
One of the issues we see is ideally, as we spend more on the pharmaceutical side of the business or on the drug side, we are getting some commensurate benefit on the medical side and we are reducing medical trend in some way. That is the ideal goal if we approach this from a value- or an outcomes-based perspective, is the more effective we are at promoting good drug therapy, promoting compliance to therapy, promoting compliance to guidelines and best treatment, to get that coordinated care approach in place, which may reduce toxicities, which may improve patient response.
Not having patients wind up in the hospital because they were told they were going to have severe nausea and vomiting, and when it occurs they accept it rather than say maybe I need to call my physician or my nurse care manager, whomever it might be, because they told me if I do have any nausea or vomiting to call. Whereas, it is not just a case where they expect it to be and then they wind up dehydrated and now you have got that whole cascade of events occurring. So I think that is really important to think about with this.
Slide 95
Dr. Atkins: And I am going to address the question that just came in: “What is the current belief regarding retreatment with IO products for patients who progress following adjuvant use?”
So, my own view of this—well, first of all, we have very little data and that is sort of scary, because so much of the use of these products in the future is going to be in the adjuvant space, which means a lot of our patients with metastatic disease will have already seen anti–PD-1-based therapy. And we have no idea whether they will respond or not.
But my own view is if you get an anti–PD-1 or anti–PD-L1 in the adjuvant setting, when there is so little tumor burden around that you cannot even see it, and you get a year of therapy, and your disease comes back, then you are not going to respond in a major way, in a curative way to that treatment. And we need to figure out how that tumor escaped and probably, if you are going to treat them with immunotherapy, it should be a combination that includes another agent that the patient did not see in the adjuvant setting.
Slide 96

Dr. Kenney: “Any pricing, payment, or partnership-related learnings from the hepatitis C experience that can be applied to the immuno-oncology drugs?”
Well, I think what we saw with the hepatitis C experience was certainly a very high cost for the first drugs to launch in that space. And as competition increased, we saw the marketplace prices come down.
We have a number of IO drugs that have been approved, so as subsequent drugs do come to market, if they are priced less and, as we saw in some of Dr. Atkins' slides, there are some similarities between products from a clinical perspective, you may see plans beginning to think about applying some type of utilization management strategy to try to selectively encourage the use of certain products over others.
It is a slow process. There is not a lot of comfort level at managing the oncology space because it is a challenging one and primarily due to the secondary effects of these agents in terms of safety and side effects. But I think there is an opportunity there for health plans to work cooperatively with the oncology community to say where there is opportunity here, perhaps we can do some utilization management and apply sort of traditional small molecule tools and techniques to the large molecules on the oncology side.
Slide 97
Dr. Atkins: And very quickly, the last question that we have is: “Can tumor mutational burden be used as part of a value framework, and would this level the playing field for IO therapies?”
I think there is an opportunity for biomarkers to be used. And if you have a certain set of biomarkers associated with a certain chance of being on a tail of the survival curve, you could potentially adjust the payment that a practice would receive for giving that therapy based on the potential value of that therapy.
Back Top